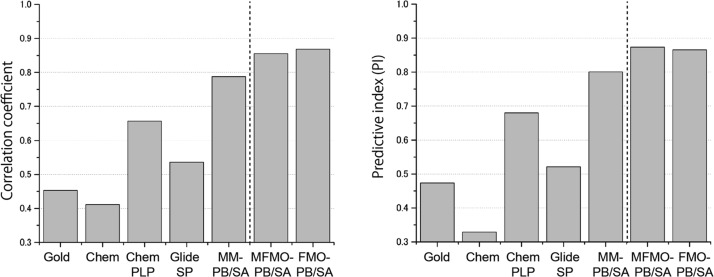
Figure 9.
Comparison of the experimental binding affinities and the calculated binding affinities obtained using the MFMO method, the conventional FMO method, the MM-PB/SA method, and the four scoring functions of molecular docking programs. The correlation coefficients and PIs are shown in the left-hand and right-hand figures, respectively. The binding affinity predictions using our scoring function based on the MFMO and the conventional FMO methods (α = 0) were compared to those of the other MM-based methods, including the scoring functions of four molecular docking programs (GoldScore, ChemScore, ChemPLP, and Glide SP) and the MM-PB/SA method. For each graph, the values to the left of the dashed line correspond to the results of the MM-based methods and the other values correspond to those of the QM-based methods.

