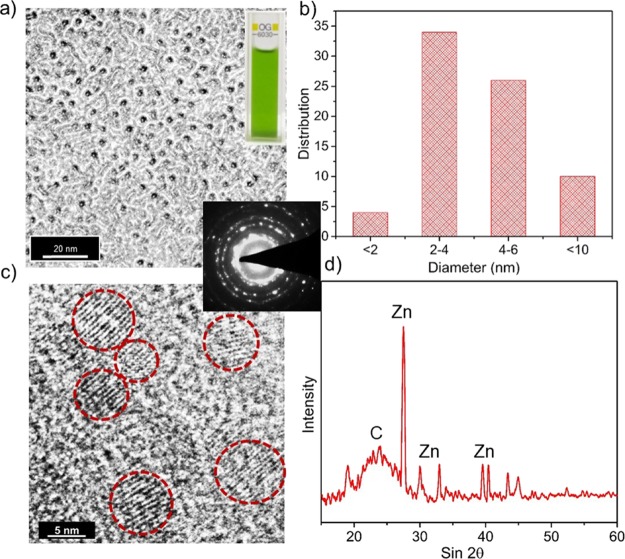
Figure 1.
(a) TEM image showing well-dispersed CZnO-Dots; inset of (a) photographic image of the CZnO-Dots in the daylight; (b) corresponding size distribution; (c) HRTEM image marked with red circles showing CZnO-Dots with graphitic fringes; the inset of (c) shows the SAED pattern and (d) powder XRD spectrum of the CZnO-Dots sample.

