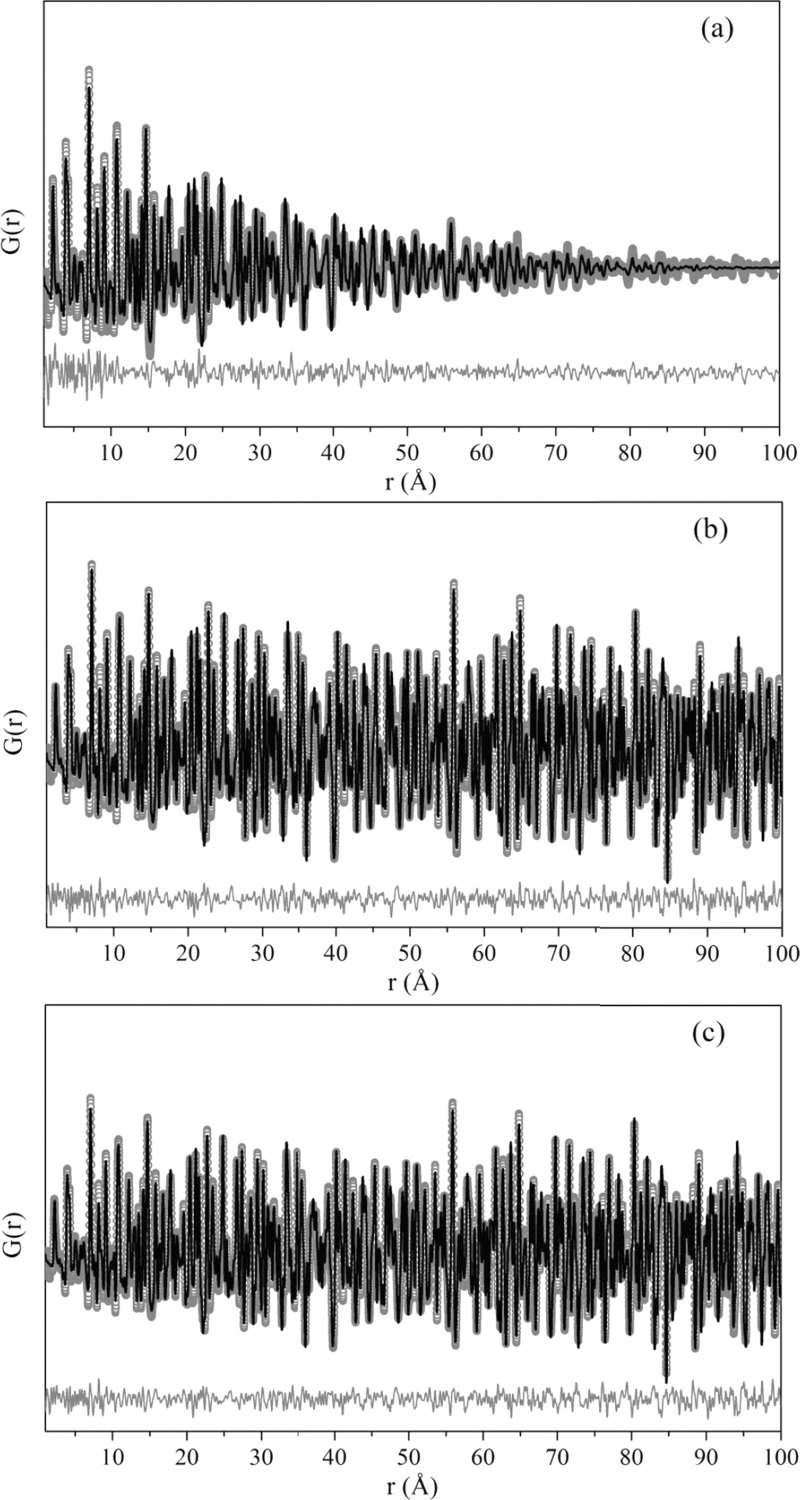
Figure 8.
Experimental (symbols) and calculated (black solid line) atomic pair distribution functions G(r) of synchrotron powder diffraction data fitted up to 100 Å. Below the functions (gray solid line) is the difference between calculated and experimental values. The PDF modeling was performed through PDFgui23 using the tetragonal structure for (a) Tb:KY3F10 as-synthesized, (b) Tb:KY3F10 heat-treated, (c) pure KY3F10 heat-treated samples.

