
Figure 2.
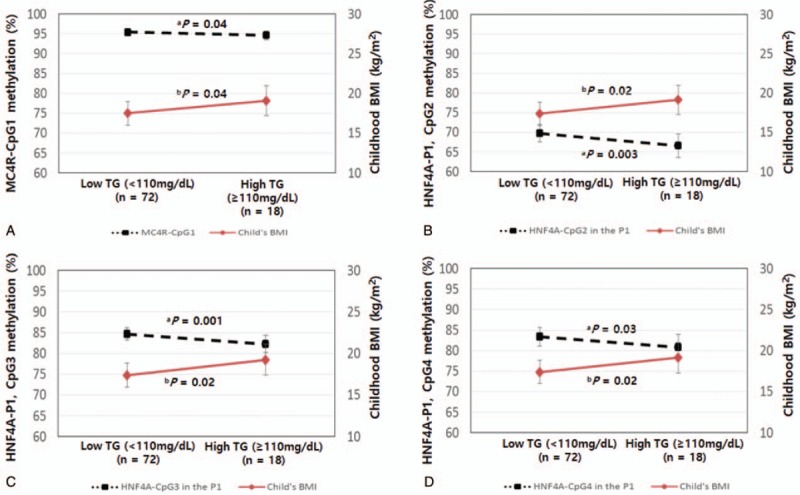
DNA methylation statuses of melanocortin 4 receptor (MC4R) and hepatocyte nuclear factor 4 alpha (HNF4α) at CpG sites in cord blood and child's body mass index (BMI) according to triglyceride (TG) levels in children. (A) P-values were calculated by analysis of covariance (ANCOVA), adjusting for maternal age, prepregnancy BMI, mother's education, gestational age (GA), sex, birth weight, child's age, child's BMI, and DNA methylation levels in children. (B) P-values were calculated by ANCOVA, adjusting for maternal age, prepregnancy BMI, mother's education, GA, sex, birth weight, child's age, and DNA methylation levels in cord blood. Dotted lines (----) represent differences in the methylation status between low TG and high TG levels. Solid lines (—) represent differences in BMI in childhood between low and high TG levels.