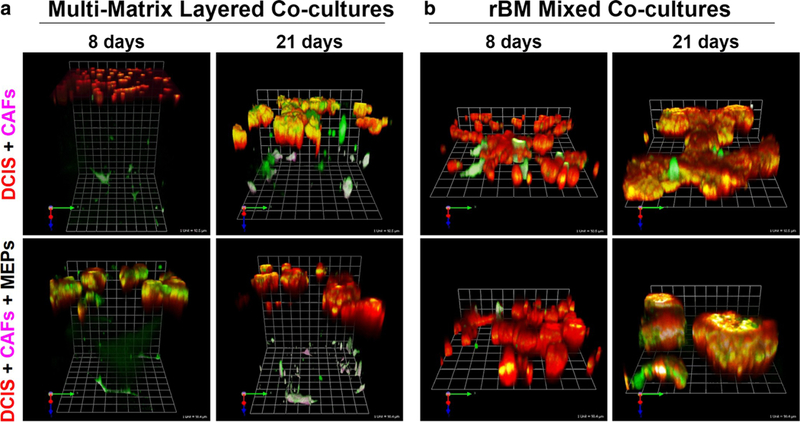
Fig. 2. Images of 3D co-cultures illustrating increases in DCIS invasive phenotype induced by co-culture with CAFs and decreases induced by co-culture with MEPs.

Multi-matrix layered co-cultures (a) and rBM mixed co-cultures (b), comprised of MCF10DCIS.com-lenti- RFP cells (red), WS-12Ti-lenti-YFP CAFs (pseudocolored fuchsia) and/or MEPs (unlabeled), are described in legend to Fig. 1. Structures and interactions were imaged live by confocal microscopy and proteolysis was assessed by a live-cell proteolysis assay developed in our laboratory [115]. Green fluorescence in A represents degradation products of DQ-collagen IV in the top layer of rBM and DQ-collagen I in the bottom layer of type I collagen. Green fluorescence in B represents degradation products of DQ-collagen IV in rBM. Degradation at surface of structures or cells appears pink-white on CAFs and yellow-white on DCIS cells. Representative angled views of 8- and 21-day co-cultures are tiled from 16 contiguous fields of optical sections taken through the entire depth of the 3D co-cultures and reconstructed in 3D with Volocity software; one grid unit = 92 μm (top) and 90 μm (bottom). For details on assembling and imaging the co-cultures and detailed methodologies for live-cell proteolysis assay and quantification of cell numbers, growth in 3D, degradation products and invasiveness, see [56, 115–117]
