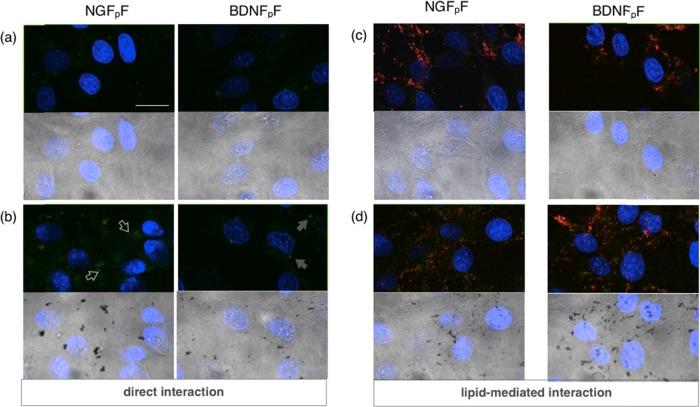
Figure 5.
LSM images of iHBMECs incubated for 2 h (37 °C, 5% CO2) with (a) NGFpF (or BDNFpF), (b) NGFpF (or BDNFpF)/AuNP, (c) NGFpF-PC (or BDNFpF-PC), and (d) NGFpF-PC (or BDNFpF-PC)/AuNP. Scale bar = 20 μm. Each sample consists of merged fluorescence images of nuclei (blue; DAPI, λex/em = 405/425–475 nm), peptides (green; Fam, λex/em = 488/500–530 nm), and lipids (red; rhodamine, λex/em = 543/550–650 nm) (top panels) and merged DAPI emission and optical bright-field images (bottom panels).

