
Figure 2.
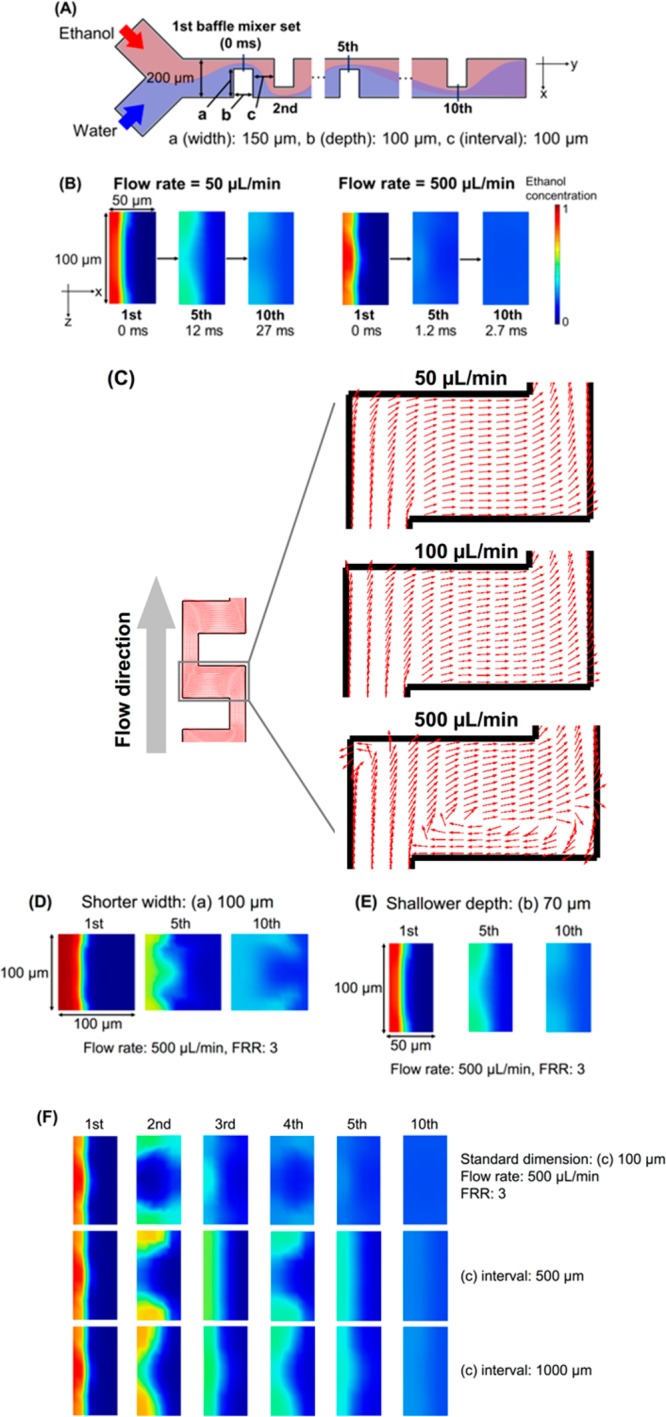
(A) Schematic illustration of the iLiNP device and part of the observation position for dilution performance. (B) Comparison of CFD simulation results for the flow rates of 50 μL/min (left) and 500 μL/min (right); flow rate ratio (FRR) of water to ethanol was 3 for both comparisons. The observation positions were the iLiNP device at the first, fifth, and tenth sets. Red and blue colors represent ethanol and water, respectively. (C) Top views of the baffle mixer region. The flow rate was varied from 50 to 500 μL/min, and FRR was 3. The arrows represent the streamlines. (D, E, F) CFD results for modified dimensions of the baffle mixer structure at 500 μL/min and FRR of 3: (D) (a) of 100 μm width, (E) (b) of 70 μm depth, and (F) (c) of 500 and 1000 μm intervals. Red and blue colors represent ethanol and water, respectively.