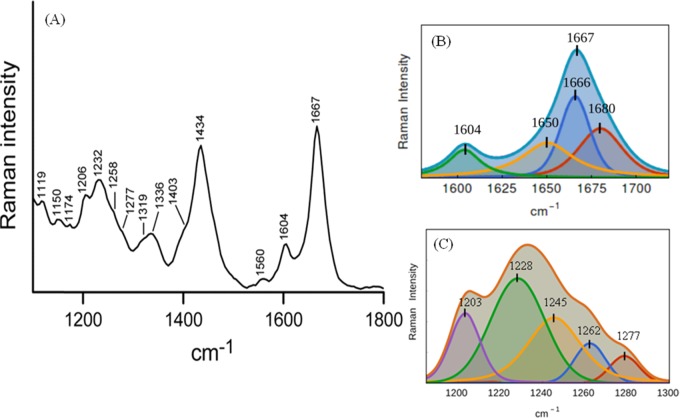
Figure 2.
Raman spectra of Aβ40 oligomers. (A) Raman spectra of Aβ40 oligomers in the frequency range of 1150–1800 cm–1 by a 532 nm laser. Oligomerized peptide solution was prepared in a 10 mM phosphate buffer, pH 7.2. The peptide solution (1.5 mg/mL) was incubated for 3 h at room temperature. To record the Raman spectrum, 20 μL of the sample solution was dropped onto a glass cover slip and the spectra were recorded at room temperature (25 °C). Laser power at the source was 30–35 mW, ∼2 mW at the sample. The recording scan time was 15 s, and the number of scans was 10. The displayed spectrum was the average of three/five such measurements. (B) Curve fitting of the amide I region of the Raman spectrum. The band fitting was based on a standard protocol as stated in Experimental Section. Three component bands that represent total amide I bands are shown separately. The violet line is the original spectrum, the red, blue, yellow, green lines are the individual component bands, and the cyan line is the sum of the bands. The fitted peak positions are also marked. 1604 cm–1 corresponds to vibration from the side chain residue. (C) Amide III region of the same spectrum and five component bands as obtained by curve fitting; their peak positions are marked.

