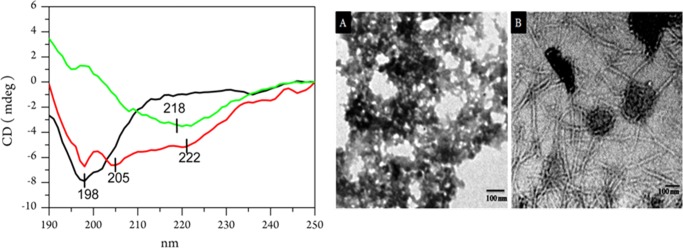
Figure 3.
CD spectra and TEM images of Aβ40 species. Left panel shows far-UV CD spectra of Aβ40 (1.5 mg/mL) dissolved in a 20 mM phosphate buffer of pH 7.2, at room temperature (25 °C). In the panel, the black line is the spectrum of the peptide monomer, recorded just after preparing the solution, the red line is for the oligomer, and the green line is for the fiber state of the peptide. Oligomer solution was prepared in a 20 mM phosphate buffer of pH 7.2, and the incubation time was 3 h. Aβ40 fiber was prepared in a 20 mM phosphate buffer of pH 7.2 at T = 25 °C, and the incubation time was 2 days (green line). The path length of the measuring cell was 0.1 cm, and each spectrum was an average of three scans. Right panel shows TEM images of Aβ40 oligomer (A) and Aβ40 fiber (B). The sample preparation condition was the same as above. Details of the recording conditions are given in the Methods section. Size of the scale bar is 100 nm.

