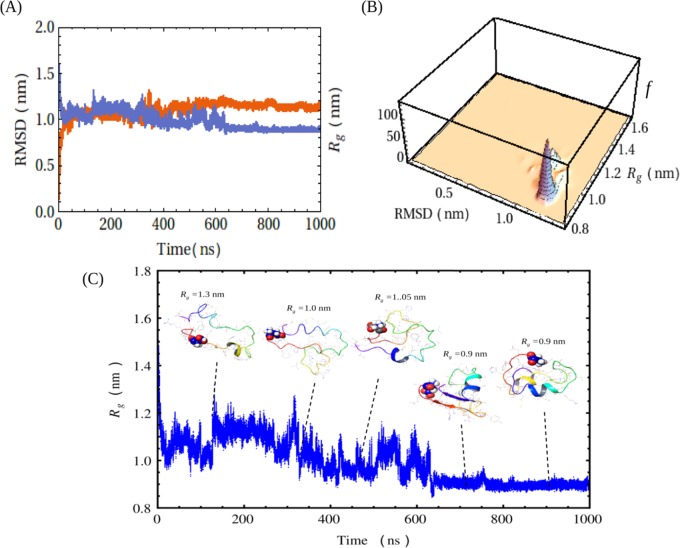
Figure 4.
Conformational clustering and compactness of the peptide as obtained via MD analysis using Desmond algorithm. (A) Plot of RMSD and radius of gyration (Rg) against simulation time during a 1000 ns molecular dynamics simulation of Aβ40 at 310 K. Red listing indicates RMSD and blue listing indicates Rg. (B) Conformational clustering of the peptide by correlating the Rg with RMSD values obtained from simulation. The 3D histogram plot of Rg against RMSD shows the conformational clustering, where f is the frequency. (C) Structures generated at different time intervals of simulation and representative snapshots are shown. The simulation time and the Rg for each snapshot are given. The lower blue scattered plot shows the refinements in the radius of gyration of the Aβ40 backbone in the same time frame. N-Terminus of the peptide was marked by the Asp residue in the CPK model.

