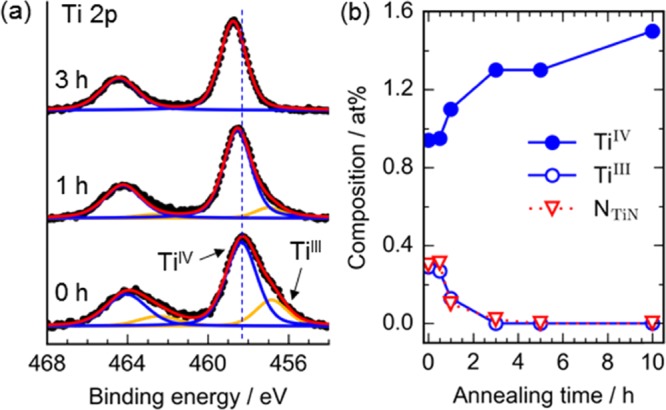
Figure 2.

Elemental states of Ti ions analyzed using the core-level X-ray photoelectron spectra: (a) Ti 2p spectra. The black dots show the experimental data, the red curves are the simulated spectra, and other curves are fitted peaks of the Voigt functions. The vertical dotted line shows the position of the TiIV peak in the sample annealed for 0 h. (b) Composition change with annealing retention time.
