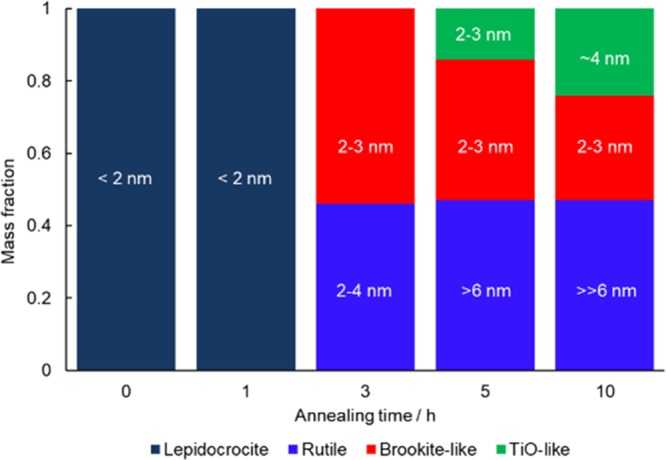
Figure 5.

Summary of phase information. The numbers on the bars are the domain sizes determined by the PDF analysis, except the rutile particle sizes in the samples annealed for 5 and 10 h, which were observed by TEM observation. Details are discussed in the main text.
