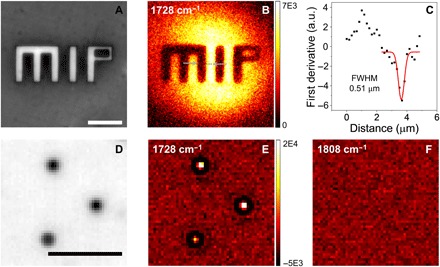
Fig. 4. WPS imaging of etched pattern in PMMA film and microparticles.

(A) Reflection image of the pattern, where the etched-off parts showed higher reflectivity. (B) WPS image of the same area. (C) First derivative of the intensity profile along the line shown in (B) as squares. a.u., arbitrary units. Gaussian fitting (red line) showed an FWHM of 0.51 μm. (D) Reflection image of 1 μm of PMMA particles. (E) WPS image of the same area with the pump at 1728 cm−1. (F) Off-resonance image showed no contrast. Scale bars, 10 μm.
