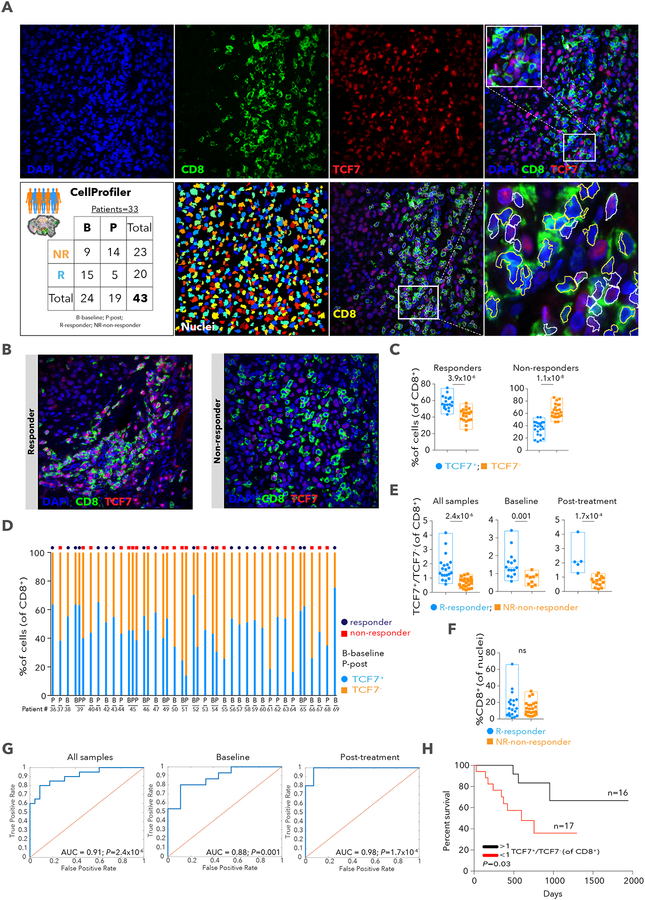
Figure 3. Immunofluorescence staining and automated image analysis for the quantification of CD8+ T cells expressing TCF7.
A. Schematic illustration of the immunofluorescence (IF) analysis pipeline. B. Representative images from the multiplex IF of tissue stained for nuclei using DAPI (blue), CD8 (green) and TCF7 (red) from a responder and non-responder patient prior to therapy with anti-PD-1. Original magnification X400. C. % of CD8+TCF7+ and CD8+TCF7− cells showing each sample. D. % TCF7+ and TCF7− cells, out of all CD8+ T cells, per sample, with clinical status above bars. E. TCF7+CD8+/TCF7−CD8+ cell number ratio. F. % of CD8+cells out of all nuclei. ns-non-significant. G. Receiver operating characteristic (ROC) analysis was constructed to evaluate the prognostic power of the TCF7+CD8+/TCF7−CD8+ ratio. The area under the ROC curve (AUC) was used to quantify response prediction. H. Kaplan-Meier survival curve for 33 patients treated with anti-PD-1 therapy. Patients were divided into two groups based on TCF7+CD8+/TCF7−CD8+ ratio (n=16 >1; n=17 <1) from IF. Data are represented as mean±SEM.

