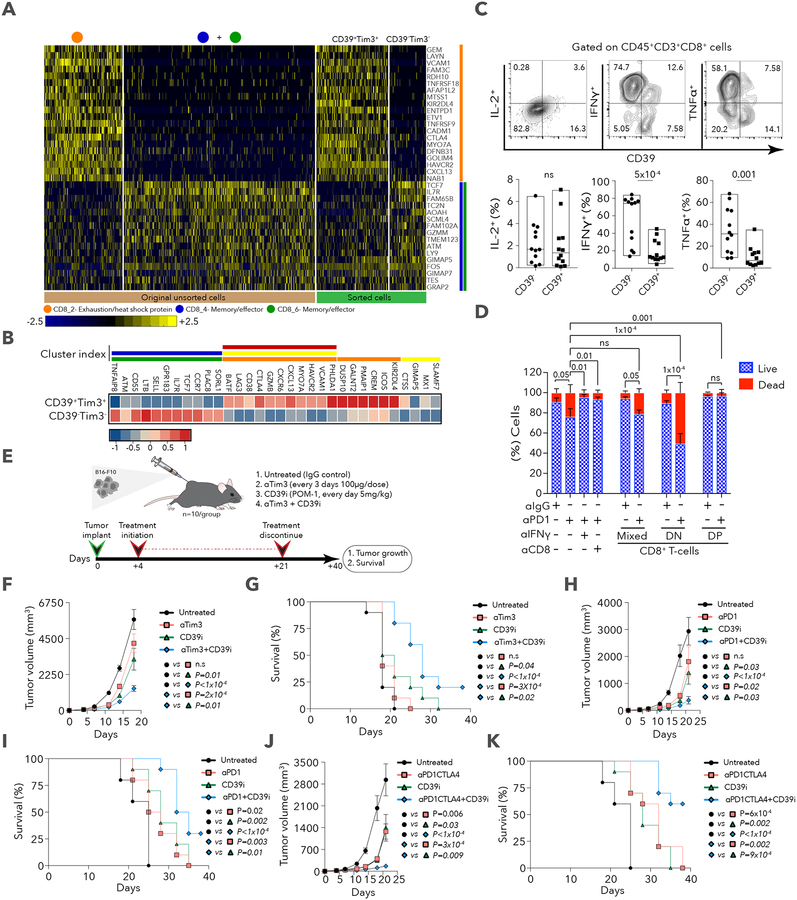
Figure 5. Discriminating exhausted from memory cells using TIM3 and CD39.
A. Heatmap showing scaled expression values of discriminative gene sets between CD8_2 (exhaustion-like) and CD8_4+6 (memory/effector-like) using original unsorted, and sorted (CD39+TIM3+ and CD39−TIM3−) cells. B. Heatmap of scaled expression values of discriminative gene sets between sorted CD39+TIM3+CD8+ and CD39−TIM3−CD8+ T cells. Colored bars above heatmap show the CD8+ cluster (as in Figure 4A) in which the gene is enriched C. Representative flow cytometry plots for intracellular staining of IL-2, IFNγ and TNFα in CD39− and CD39+ cells, with quantification below for 12 patients. Data were combined from 2 replicate experiments. D. Quantification of live/dead cells based on staining of CT26GFP+ MDOTS on day 5 of ex vivo culture. One of two independent experiments is shown, with n=3 replicates per group per experiment. 2-way ANOVA, Tukey’s multiple comparisons test. E. A schematic summary of the therapy regimen used in the transplantable B16-F10 mouse model. F. Tumor volumes for all 4 groups. G. Survival of B16-F10 tumor-bearing mice treated with CD39i in combination with anti-TIM3. H. Tumor volumes for untreated, anti-PD-1, CD39i and anti-PD-1+CD39i treated groups. I. Survival of B16-F10 tumor-bearing mice treated with CD39i + anti-PD-1. J. Tumor volumes for untreated, anti-PD-1/CTLA4, CD39i, anti-PD-1/CTLA4+CD39i. K. Survival of B16-F10 tumor-bearing mice treated with CD39i and anti-PD-1/CTLA4. Data are represented as mean±SEM. For in vivo mouse tumor models one of two independent experiments is shown.

