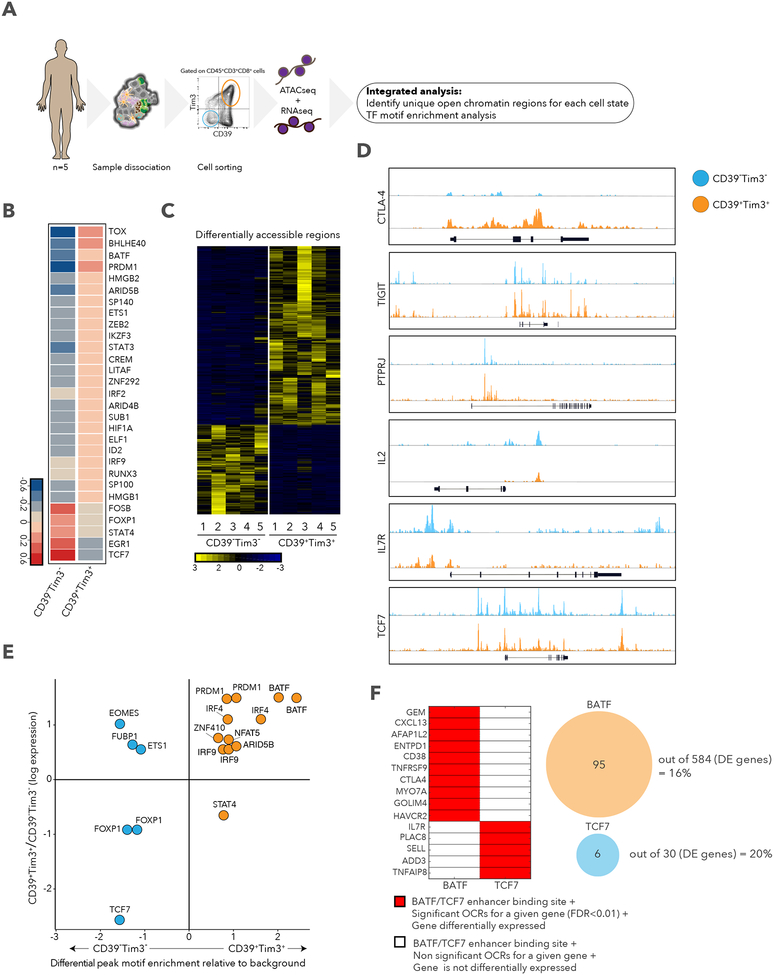
Figure 6. Differential chromatin accessibility in CD39+TIM3+ and CD39−TIM3− cells.
A. Schematic of ATAC-seq analysis performed on sorted CD39+TIM3+ and CD39−TIM3-cells. B. Heatmap describing averaged scaled expression values of differentially expressed transcription factors for sorted CD39+TIM3+ and CD39−TIM3− cells. C. Heatmap describing patient specific (n=5) differentially accessible regions (FDR<0.01) in CD39+TIM3+ and CD39−TIM3− sorted populations. D. ATAC-seq traces for open chromatin regions near selected genes in CD39+TIM3+ (orange) and CD39−TIM3− (blue) cells. E. Graph depicting enrichment of TF motifs based on open chromatin specific to CD39−TIM3− (blue) vs. CD39+TIM3+ (orange) cells (x-axis), and differential expression of TFs (y-axis). F. Left, enhancer binding sites for BATF and TCF7 near the listed genes. Significant genes, red; non-significant, white. The same genes are also differentially expressed between CD39+TIM3+ cells and CD39−TIM3− cells. Right, the number of genes that are differentially expressed with a corresponding differential peak containing BATF or TCF7 is shown.

