
Figure 2:
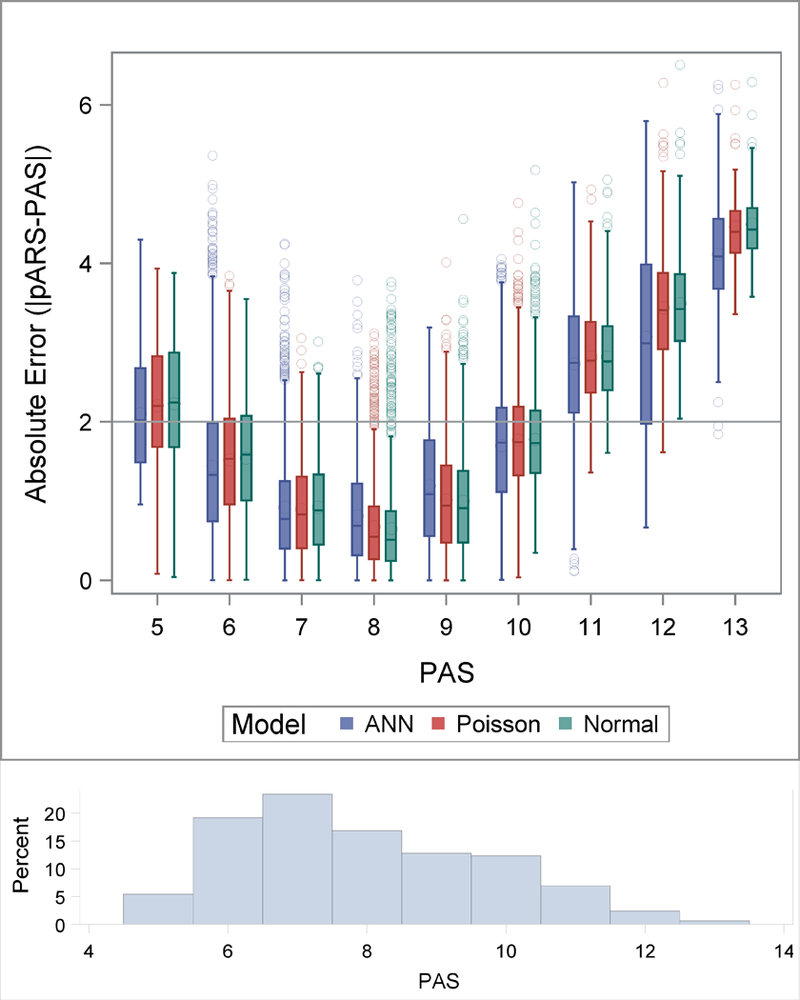
Absolute error of pARS plotted at each PAS value for the ANN, Poisson and Normal Models in the balanced test set. The distribution of the absolute errors are represented using box plots, the boxes extend to the 25th and 75th percentiles, the median values are indicated with a line inside the box and means are denoted with a large circle. The whiskers extend to 1.5 times the interquartile range and values outside of that are indicated with points. A reference line at 2 is plotted. A histogram of the PAS scores is displayed at the bottom of the figure.