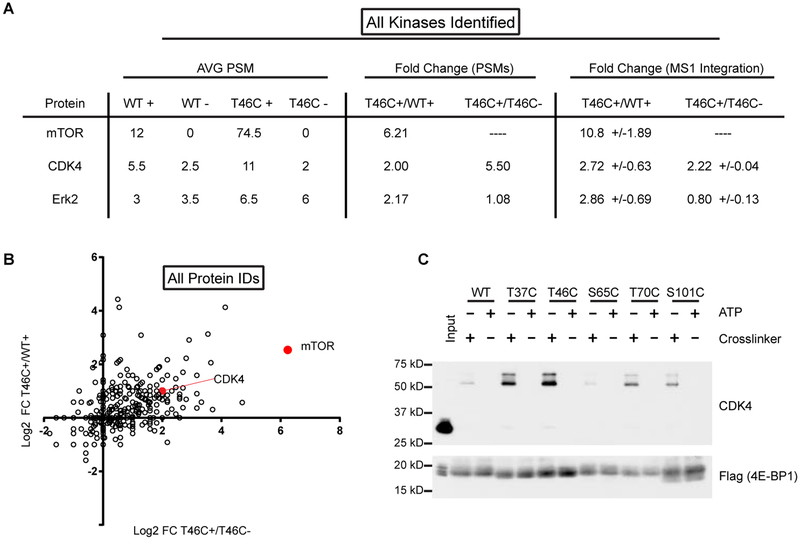
Figure 2 |. MS-analysis of PhAXA pulldown identifies mTOR and CDK4 as 4E-BP1 kinases.
A, Table of kinases identified by at least 2 peptides in each biological replicate following filtering of common contaminants (Mellacheruvu et al., 2013). Average peptide-spectrum matches (PSMs) are from 2 biological replicates. ‘+’ refers to samples treated with 1; ‘-’ refers to ATP only controls. Dashes were added for ratios that could not be calculated due to absence of any high scoring PSMs. The ratio of MS1 intensities was determined using Skyline (MacLean et al., 2010a). Fold change is represented as +/−standard deviation (n = 3–13). B, Log2 fold change of spectral counts for non-filtered proteins plotted for the T46C probe relative to the appropriate controls. 1 PSM was added to each sample before averaging to enable calculation of the fold change for samples with no PSMs. C, CDK4 is enriched from lysate expressing 3x-FLAG-4E-BP1 phosphosite-to-Cys mutants. A representative input is shown to demonstrate the mass-shift of CDK4 upon crosslinking to 4E-BP1.

