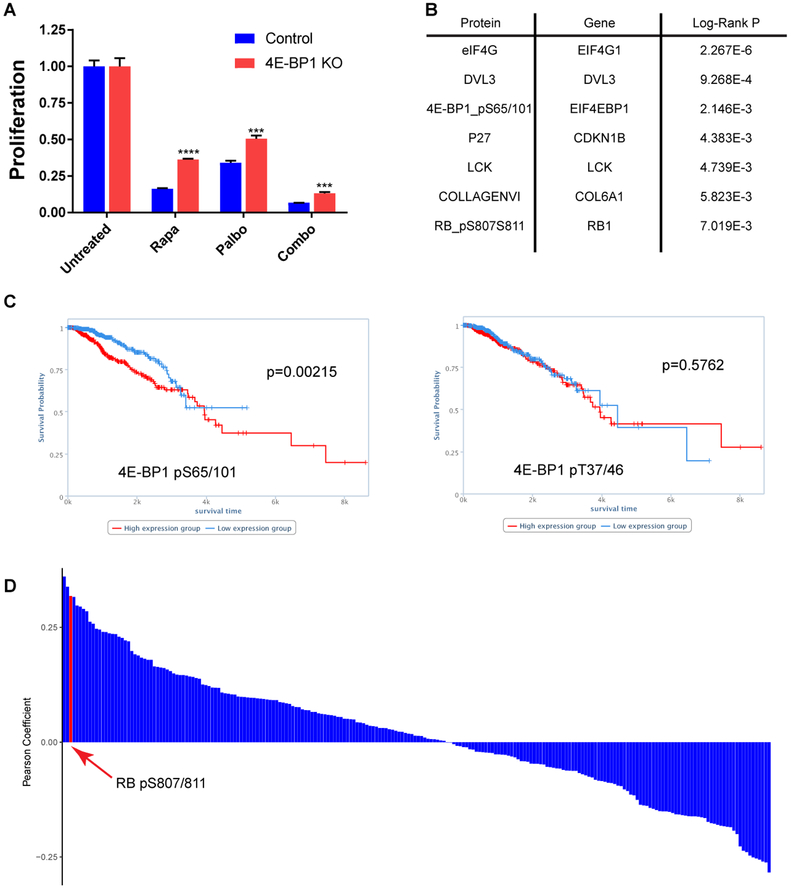
Figure 6 |. CDK4-mediated phosphorylation of 4E-BP1 serves as a biomarker for predicting breast cancer survival.
A, Proliferation of MCF-7 cells +/− 4E-BP1 knockout treated with rapamycin and/or palbociclib assessed by CellTiter Glow assay. Treated samples are shown relative to no treatment control for that cell line. Bars represent mean +/− standard deviation (n=3) ***P<0.001, ****P<0.0001. B, List of proteins/antibodies with the highest correlation to survival in the BRCA dataset from TCPA. Shown are all antibodies with a Log-Rank P value of <0.01. P-values were used as reported by TCPA. C, Kaplain-Meyer curves showing the total survival time for BRCA patients from the TCPA dataset with high (red) and low (blue) p4E-BP1(S65/101). D, Histogram showing the Pearson Coefficient for pairwise regression between p4E-BP1 (S65/101) and every other antibody in the dataset.

