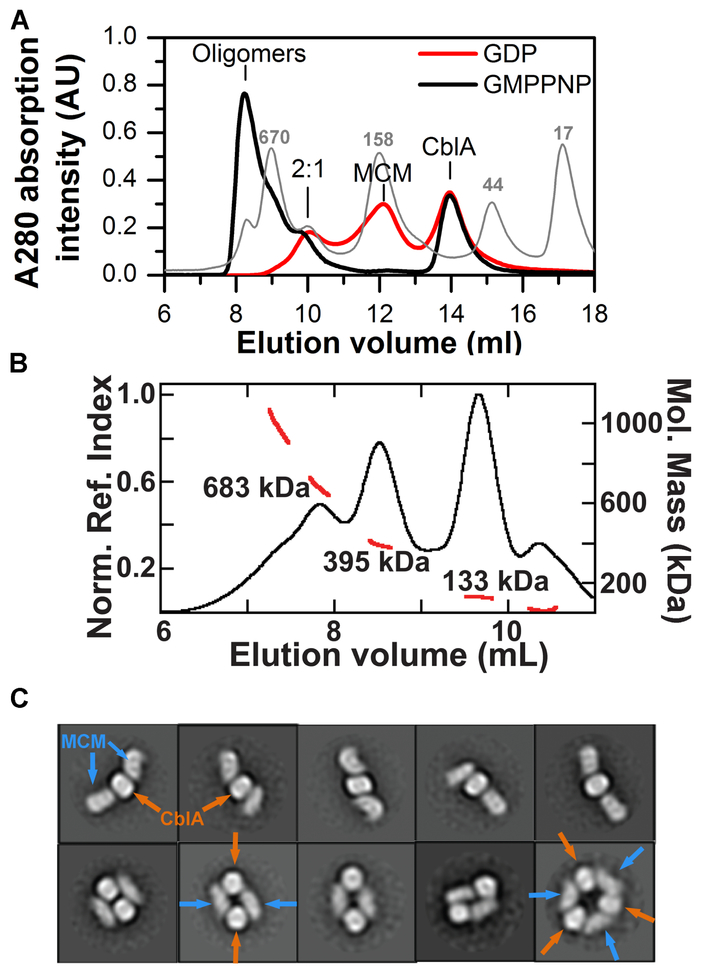
Figure 2. Oligomeric states of MCM-wild-type CblA complexes.
(A) Distribution of complexes formed upon mixing MCM (25 μM) and CblA A (50 μM) in the presence of GMPPNP or GDP (500 μM each). Positions of the calibration standards are indicated in the light gray trace. (B) SEC-MALS analysis of a mixture of MCM (25 μM) and wild-type CblA (25 μM) in the presence of GMPPNP (250 μM). The black trace represents the normalized refractive index (left axis). The red line indicates the molecular weight as detected by MALS (right axis). (C) 2D class averages of the 395 kDa peak shows heterogeneity of oligomeric forms. The orange and blue arrows denote CblA and MCM, respectively.

