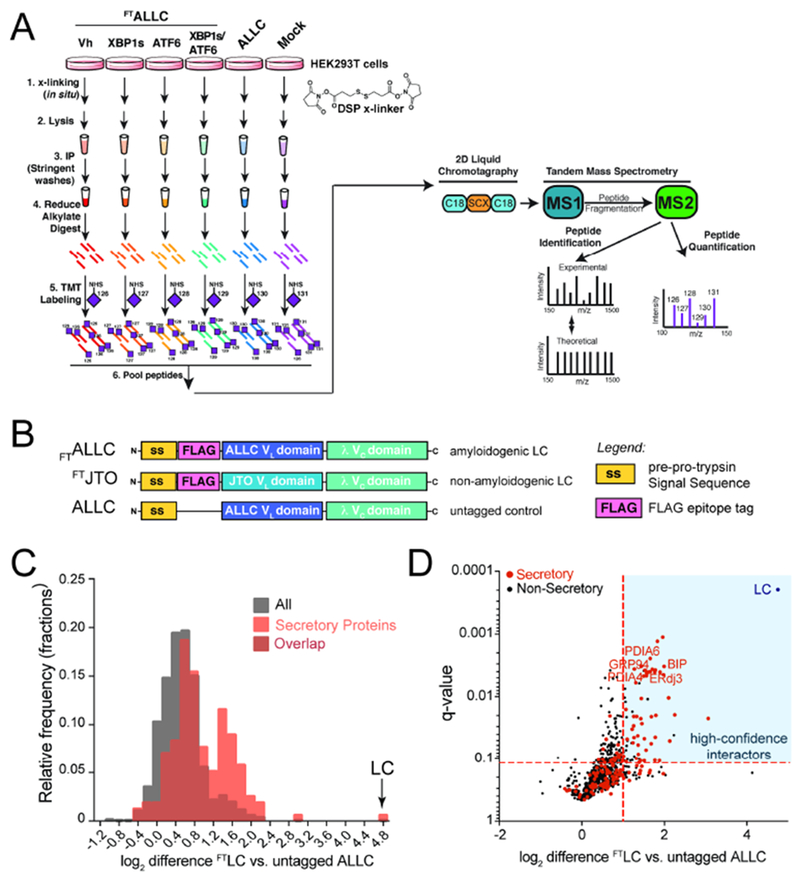
Figure 1. Establishing an AP-MS platform to identify ER proteostasis factors that interact with destabilized, amyloidogenic ALLC.

A. Schematic of the multiplexed quantitative interactomics methodology, which combines affinity purification mass-spectroscopy (AP-MS) with in situ DSP cross-linking to capture transient, low affinity interactions with proteostasis network components. Sixplex tandem mass tags (TMT) are used for relative quantification of proteins in individual AP samples, followed by MuDPIT (2D LC coupled to Tandem mass spectrometry).
B. Illustration showing the domain organization for the flag-tagged destabilized, amyloidogenic LC ALLC (FTALLC), the flag-tagged energetically normal LC JTO (FTJTO), and untagged ALLC. A sequence alignment of ALLC and JTO showing the differences in amino acid sequence is shown in Fig. S1A.
C. Histogram displaying TMT ratios of FTLC (combined n=4 FTALLC and n=6 FTJTO replicates) vs. untagged ALLC (mock) channels for all protein (grey) and filtered secretory protein (red).
D. Plot showing TMT ratio (log2 difference FTLC vs. untagged ALLC) vs. q-value (Storey) for proteins that co-purify with FTLC (either FTALLC or FTJTO) compared to untagged ALLC in anti-FLAG IPs (n=10 biological replicates; n = 4 for FTALLC and n = 6 for FTJTO). High confidence interactors are identified in the blue quadrant showing TMT ratio >2 and a q-value < 0.11. Secretory proteins are shown in red. Full data included in Supplemental Table 1.
