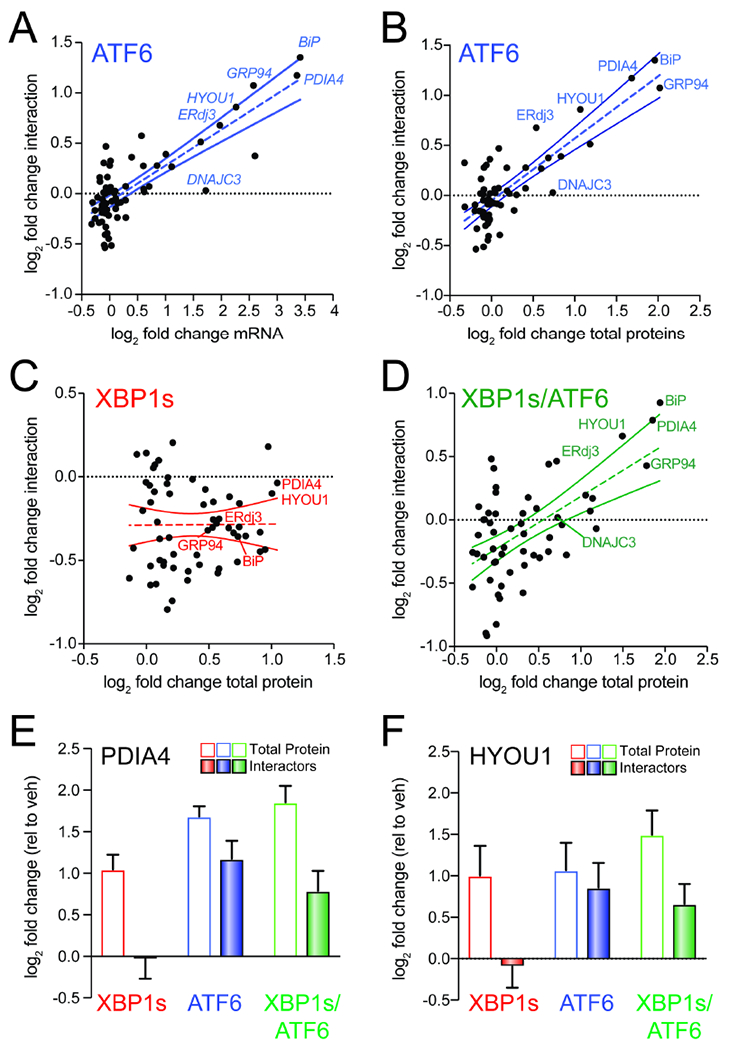
Figure 4. ATF6-dependent increases in ALLC interactions correlate with ER proteostasis factor expression.

A. Plot comparing mRNA level for high confidence ALLC interacting proteins (measured by RNAseq in (Plate et al., 2016); n=3 biological replicates) vs. their increased interactions with FTALLC in HEK293DAX cells following stress-independent ATF6 activation (n=7 biological replicates). The dashed line shows least-squares linear regression. The solid lines show 95% confidence intervals.
B. Plot comparing cellular protein level for high confidence ALLC interacting proteins (measured by whole cell quantitative proteomics in (Plate et al., 2016); n=3 biological replicates) vs. their increased interactions with FTALLC in HEK293DAX cells following stress-independent ATF6 activation (n=7 biological replicates). The dashed line shows least-squares linear regression. The solid lines show 95% confidence intervals.
C. Plot comparing cellular protein level for high confidence ALLC interacting proteins (measured by whole cell quantitative proteomics in (Plate et al., 2016); n=3 biological replicates) vs. their increased interactions with FTALLC in HEK293DAX cells following stress-independent XBP1s activation (n=7 biological replicates). The dashed line shows least-squares linear regression. The solid lines show 95% confidence intervals.
D. Plot comparing cellular protein level for high confidence ALLC interacting proteins (measured by whole cell quantitative proteomics in (Plate et al., 2016); n=3 biological replicates) vs. their increased interactions with FTALLC in HEK293DAX cells following stress-independent ATF6 and XBP1s co-activation (n=4 biological replicates). The dashed line shows least-squares linear regression. The solid lines show 95% confidence intervals.
E. Graph showing changes in protein levels (open symbols; n=3) or FTALLC interactions (solid bars; n=4-7) for PDIA4 in HEK293DAX cells following stress-independent XBP1s (red), ATF6 (blue), or XBP1s and ATF6 (green) activation. Error bars show SEM for the individual replicates.
F. Graph showing changes in protein levels (open symbols; n=3) or FTALLC interactions (solid bars; n=4-7) for HYOU1 in HEK293DAX cells following stress-independent XBP1s (red), ATF6 (blue), or XBP1s and ATF6 (green) activation. Error bars show SEM for the individual replicates.
