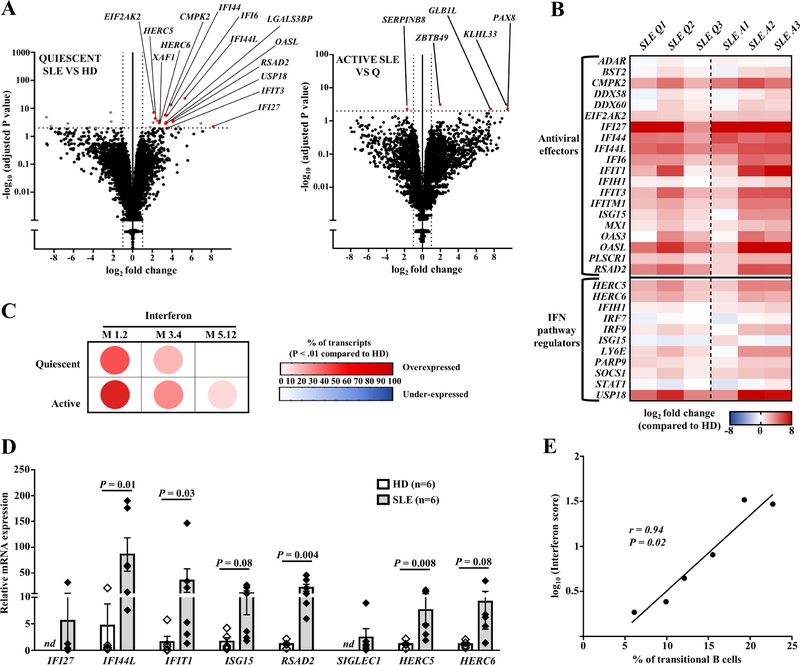
Fig. 3.
(A) Volcano plot representation of RNA-Seq data comparing transitional B cells from HDs (n=6) versus untreated quiescent SLE patients (n=3) (left panel) and transitional B cells from untreated quiescent versus active patients (n=3) (right panel). (B) Hierarchical representation of interferon stimulated genes (ISGs) expression in transitional B cells from each patient compared to HDs. (C) Modular analysis of RNA-Seq data representing the % of transcripts over/under-expressed (P<0.01) in untreated SLE patients (quiescent, n=3; active, n=3) compared to HDs (n=6). (D) qRT-PCR of ISGs in sorted transitional B cells of quiescent SLE patients compared to HDs. (E) Correlation between transitional B cells (% of CD19+ cells) and the interferon score. HDs: healthy donors; ND: not detected; SLE: Systemic lupus erythematosus.

