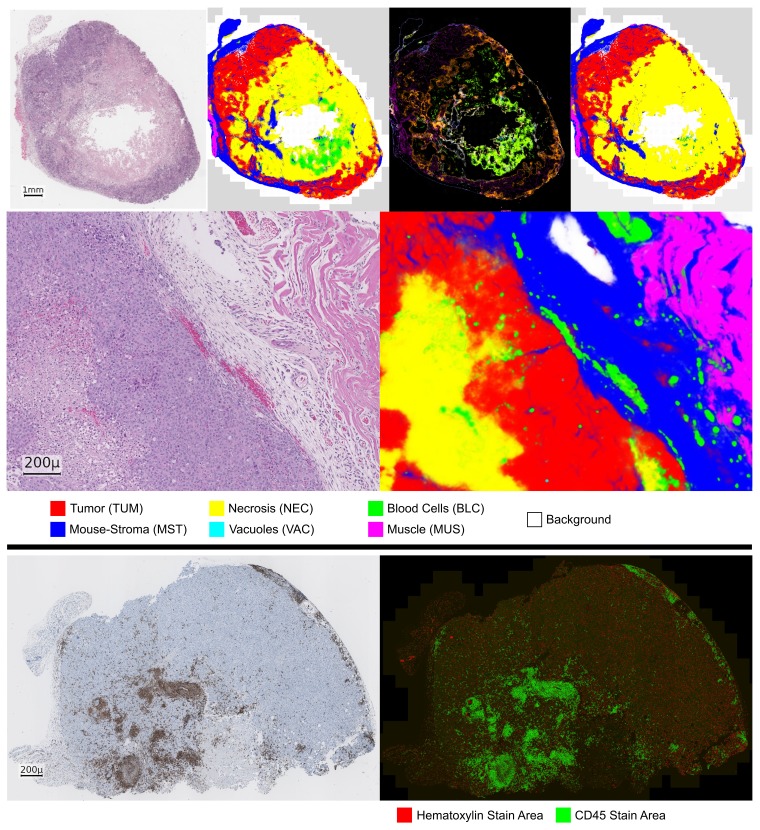
Figure 2. Prediction of the HistoNet architecture on an input sample (NSCLC PDX).
Top, from left to right: input slide, prediction average map, variance map, corrected tissue map. Middle: detail view of a different slide (NSCLC PDX) with input (left) and prediction average map (right). In the variance map, light green as a mixture of green and yellow, corresponds to a confusion of BLC and NEC class. Bottom: CD45 example (left, NSCLC PDX) with corresponding stain color decomposition (right).

