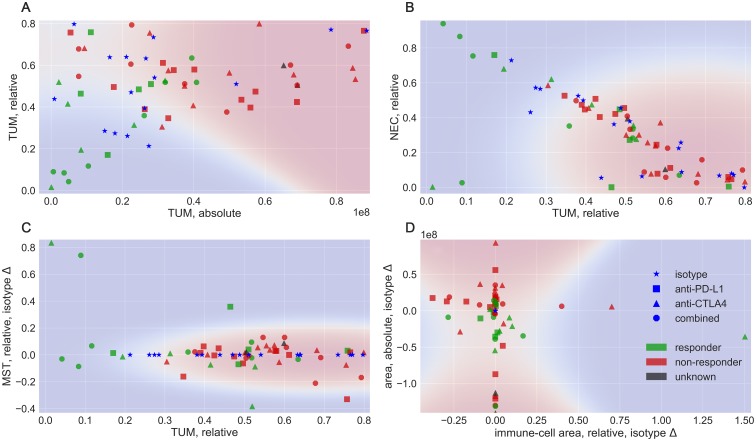
Figure 4. Examples of different feature combinations.
Colors denote the response to treatment, in blue: isotype, green: responder and red: non-responder. Shapes denote the treatment type, as star: isotype, square: PD-L1 blocker, triangle: CTLA4 blocker and circle: combined treatment. The background colors indicate a probabilistic assignment by a Naive Bayes Classifier.

