Fig. 4.
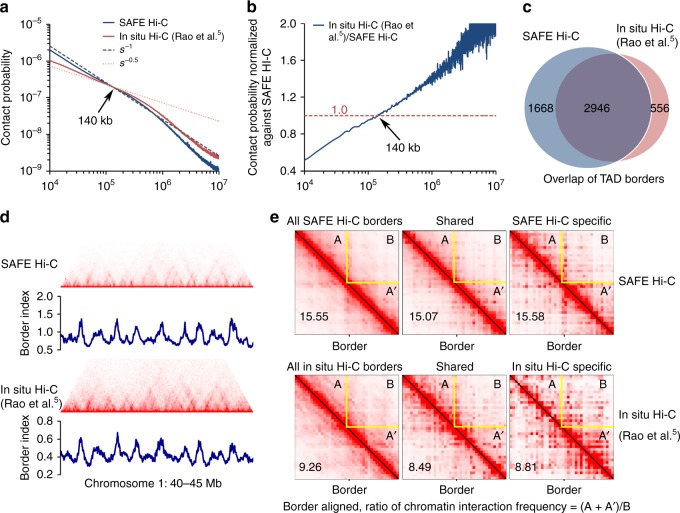
SAFE (simplified, amplification-free, and economically efficient process) Hi-C on 250 thousand human K562 cells. a Comparison of chromatin interaction frequency against the genomic distance between SAFE Hi-C (blue line) and in situ Hi-C (red line). s−1 (black dashed line) and s−0.5 (red dotted line) represent the predicted fractal globule and mitotic states, respectively. The turning point of chromatin interactions on the decaying curves for SAFE Hi-C and in situ Hi-C is indicated by an arrowhead. b Average chromatin interaction frequency of in situ Hi-C was normalized against SAFE Hi-C across the genome. The crossing point is shown by an arrowhead. c Venn diagram shows the overlap between topologically associated domains (TADs) identified for SAFE Hi-C and in situ Hi-C. d Chromatin contact heatmap and border index comparison between SAFE Hi-C and in situ Hi-C for a region in chromosome 1 from 40 to 45 Mb. e Borders were aligned for all, shared, and specific TADs. The chromatin contact frequency in flanking TADs (A + A′) was divided by that of the inter-TADs (B), the ratios of (A + A′)/B for aggregated borders are shown at the bottom left in each heatmap

