
Fig. 5.
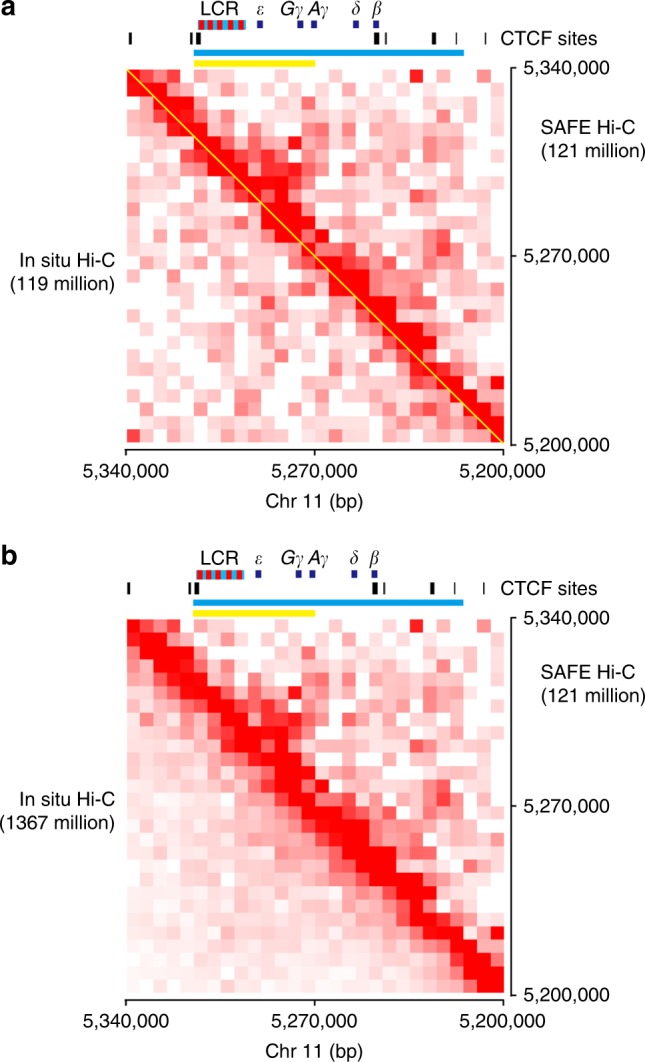
Local chromatin structure of the human β-globin locus. a Side-by-side comparison of chromatin structure of the human β-globin locus. Paired reads from similar sequencing depth of SAFE (simplified, amplification-free, and economically efficient process) Hi-C (121 million) and in situ Hi-C (119 million) were used for heatmap plotting. Human β-globin locus is shown at the top with hypersensitive sites in red and globin genes in dark blue rectangles, respectively. CTCF binding sites are shown as black vertical lines below β-globin locus. Yellow line and blue line correspond to genomic regions of small and large domain identifiable in SAFE Hi-C heatmap. The genomic region depicted here is from 5.20 to 5.34 Mb on human chromosome 11 spanning across the β-globin locus. b Side-by-side comparison of chromatin structure at human β-globin locus. Sequencing depth of in situ Hi-C is about 11 times more than that in a