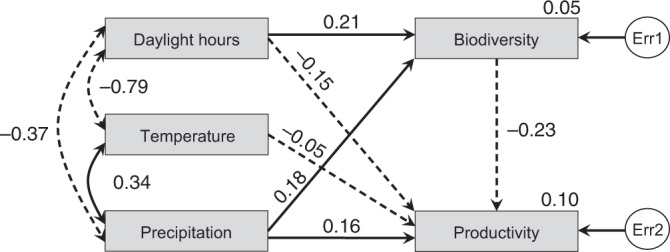
Fig. 2.

Structural equation models showing the connections between biodiversity and productivity at the plot level (N = 9640 plots). All retained arrows are significant (P < 0.05). Solid and dashed one-way arrows represent positive and negative effects, respectively. Solid and dashed two-way arrows represent positive and negative correlations, respectively. Standardized regression weights (along one-way arrows), correlations (along two-way arrows) and squared multiple correlations (beside Biodiversity and Productivity boxes) for the fitting model are shown. The exogenous unobserved variable err1 and err2 account for the unexplained errors in the estimation of biodiversity and productivity, respectively. Test statistic = 0.761, with 1 model degree of freedom and P = 0.383 (indicating close model-data fit). Source data are provided as a Source Data file
