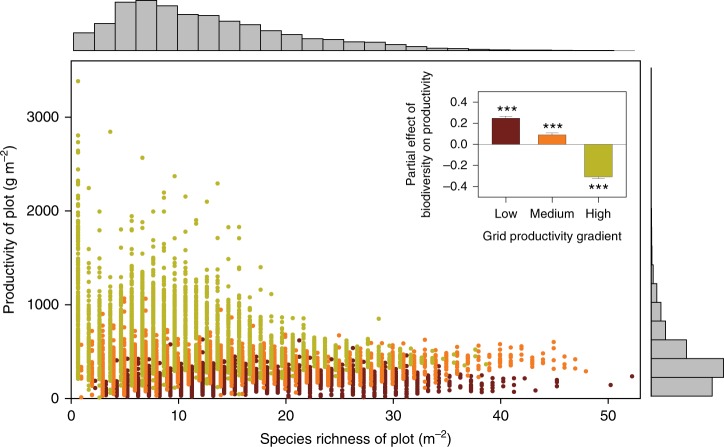
Fig. 3.
Global relationships between biodiversity and productivity in natural grasslands at the plot level. Marginal histograms show the frequency distribution of biodiversity and productivity across plots (N = 9640 plots). The 151 grids were divided into three equal groups depending on their mean productivity: low, medium, and high productivity (with 50–51 grids each), corresponding to different colors of the points (plots). Repeating the structural equation model analysis for the three groups separately, the partial effects of biodiversity on productivity along the productivity gradient are shown in the inset. Each bar corresponds to points of the same color. Symbols are slightly displaced at x-axis to improve readability. Asterisks indicate a significant difference from zero: *P < 0.05; **P < 0.01; ***P < 0.001. Source data are provided as a Source Data file

