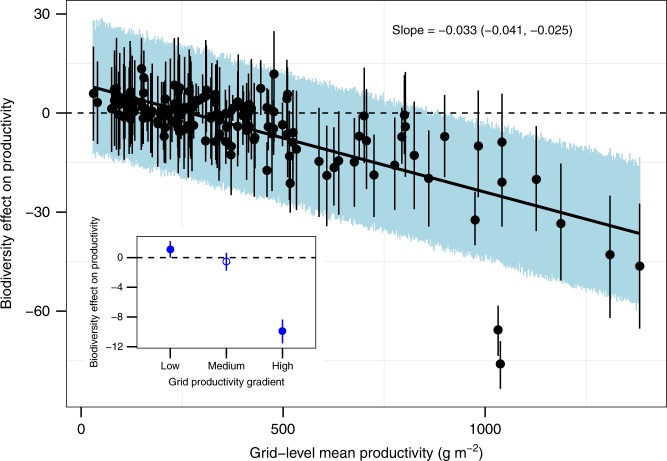
Fig. 5.
Shift in the sign and strength of the biodiversity effects across productivity gradients in hierarchical Bayesian models. Each point represents the mean productivity (horizontal axis) and the median value of biodiversity effect on productivity (vertical axis) at each grid (N = 151 grids) or grid group (low, medium, and high productivity groups in the inset). Vertical lines represent the 95% of credible intervals (CI) of estimated biodiversity effects. The solid line is the estimated relationship between mean productivity and biodiversity effect. The shaded area is the 95% CI of the estimated relationship. The text shows the median and 95% CI of the slope. The filled blue circles in the inset represent significant results. Source data are provided as a Source Data file

