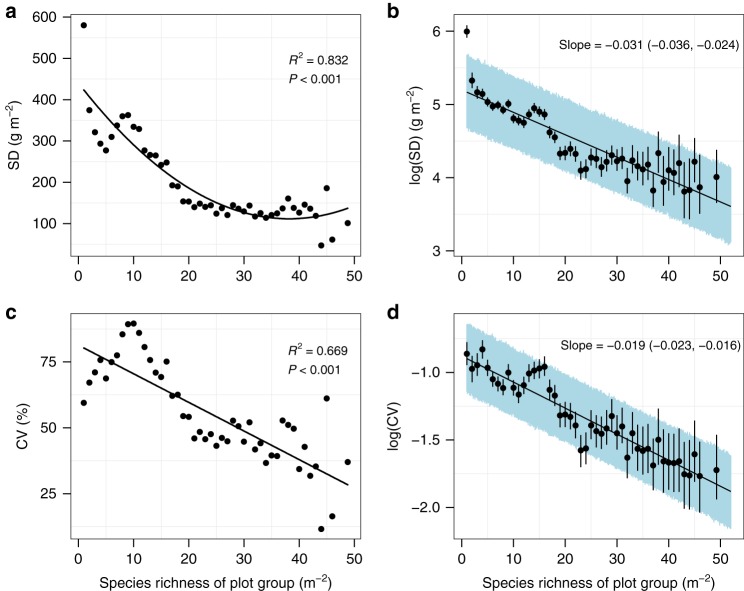
Fig. 6.
Global relationship between biodiversity and spatial variability . a, c Simple regression models. b, d Hierarchical Bayesian models. Black points and vertical lines in b, d show the medians and 95% credible intervals (CI) of log-transformed productivity variation for each species richness level. Spatial variability in grassland productivity was measured as standard deviation (SD, top panel) or coefficient of variation (CV, bottom panel) across plots with the same richness. The black line represents the fitted relationship. The shaded areas in panels b and d represent the 95% CI of the fitted relationships. The texts in panels b and d show the median and 95% CI of the slope. Species richness was used to group plots containing one, two, three species, etc. Because some high-richness levels had only one or two plots at each richness level, the 9640 plots were divided into 47 plot groups, with the last group containing 47−52 species, to ensure there were three or more plots in each group. Source data are provided as a Source Data file

