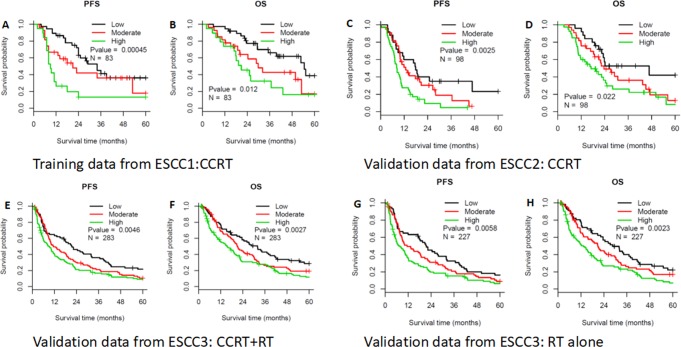
Figure 2.
Prognostic value of the compactness-based risk model. Kaplan-Meier curves for overall survival (OS) and progression-free survival (PFS) are shown for the various datasets and compactness-based risk groupings (low, moderate, and high). P-values were calculated using the log-rank test. The OS and PFS results are presented for the training dataset (A,B) and the validation datasets from Fujian (C,D) and Beijing CCRT + RT alone (E,F) or Beijing RT alone (G,H).

