Fig. 3.
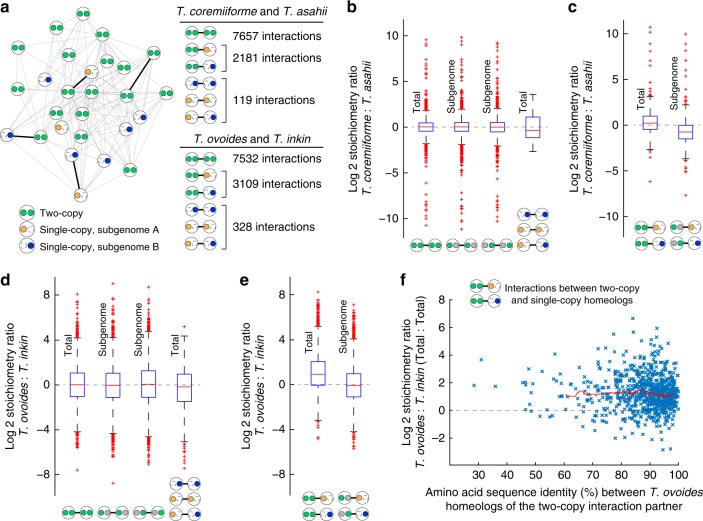
Two modes of transcriptional stoichiometry maintenance following genome hybridization. Expression levels from log-phase growth condition are shown. a Schematic of a protein–protein interaction network in hybrid species. Large circle represents a homeolog group with inner circles representing subgenome-specific homeologs. Dashed outline for inner circle indicates gene loss and solid color indicates presence. Green is used when both homeologs are present. Orange or blue is used when only subgenome A or subgenome B homeolog is present, respectively. The numbers of interactions in each category (two-copy to two-copy, two-copy to single-copy, and single-copy to single-copy) are listed. b Box plots comparing the conservation of interaction stoichiometry across T. coremiiforme and T. asahii. From left to right, the data for (i) interactions between two-copy homeologs, (ii) interactions between two-copy homeologs but considering only the transcript level of subgenome A homeologs, (iii) same as (ii) but considering only the transcript level of subgenome B homeologs, and (iv) interactions between single-copy homeologs are shown. Symbols at the bottom indicate the different sets of interactions considered in each box plot. Gray circles indicate homeologs that are present but were excluded from stoichiometry calculation in order to highlight subgenome specificity. Expression levels from log-phase growth condition are shown. Vertical labels indicate the type of stoichiometry under consideration (Total = stoichiometry involving all homeolog copies, Subgenome = stoichiometry involving only homeolog copies belonging to the same subgenome). Blue boxes designate the 25th–75th percentile ranges. Red bars indicate the medians. Black whiskers designate the approximated 0.35th–99.65th percentile ranges. Red cross markers indicate individual data points lying outside the 0.35th–99.65th percentile ranges. c Boxplots comparing the conservation of stoichiometry across T. coremiiforme and T. asahii for interactions between a two-copy homeolog group and a single-copy homeolog. d and e Similar box plots for T. ovoides–T. inkin comparisons. f Scatter plot showing the relationship between the conservation of stoichiometry across T. ovoides and T. inkin for protein–protein interactions involving a two-copy homeolog pair and a single-copy gene and the amino acid sequence identity between the homeolog copies within the two-copy group. Red trend line indicates the running median

