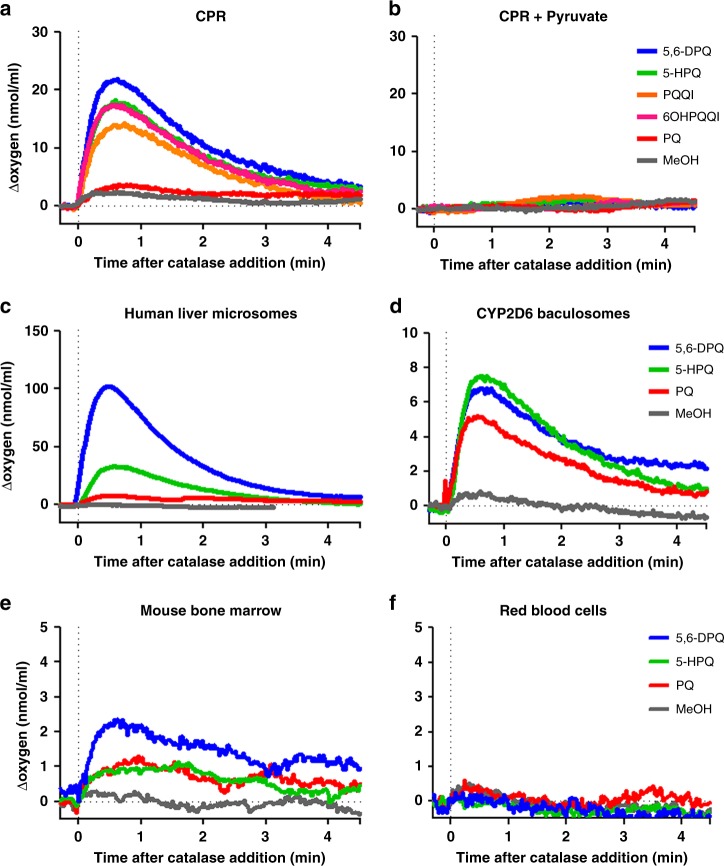
Fig. 2.
Metabolism-mediated generation of H2O2. H2O2 production was measured as catalase-mediated oxygen release after compound incubation (30 μM) with a human CPR, b human CPR + pyruvate, c human liver microsomes, d CYP2D6-expressing baculosomes, e mouse bone marrow extracts or f red blood cell extracts. The x axis was adjusted by defining the addition of catalase as t = 0, and the corresponding y axis value defined as 0 nmol mL−1. The average of two (PQ and 5,6-DPQ) and five (5-HPQ and MeOH) independent measurements are shown

