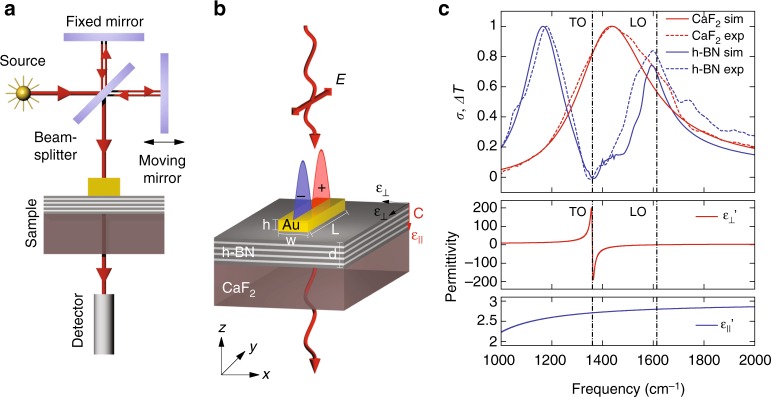
Fig. 1.
Infrared spectroscopy of gold rod antennas on top of an h-BN flake. a Schematics of the setup for the spectral far-field transmission measurements. b Schematics of the sample, illuminated by an incident plane wave: the gold rod antenna on top of the flake of h-BN placed on the CaF2 substrate. The optical axis, C, and the dielectric permittivity tensor components, ϵ⊥ and ϵ║, are indicated by the red and black arrows. c Top: normalized measured difference transmission spectra (dashed curves) and simulated extinction spectra (solid curves) for the antenna (L = 2.29 μm, w = 175 nm, and h = 50 nm) on CaF2 (red curves) and on h-BN (d = 55 nm)/CaF2 (blue curves). Bottom: real part of the perpendicular (red curve) and parallel (blue curve) components of the dielectric permittivity of h-BN as a function of frequency. Vertical dashed lines mark the positions of LO and TO phonons

