Fig. 2.
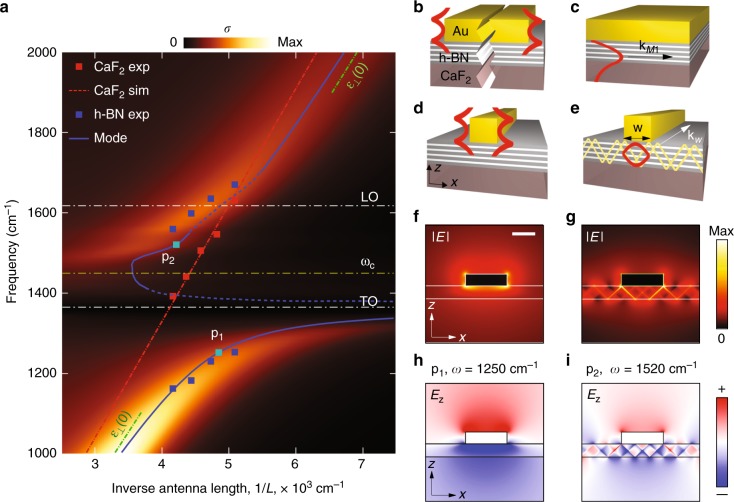
Infrared spectra of the gold rod antennas over h-BN slab for different antenna lengths and the mode analysis. a Colorplot: calculated extinction cross-section, σ, for the gold antenna on h-BN/CaF2 as a function of ω and 1/L. Symbols: maxima in the measured difference transmission spectra for the antennas on h-BN/CaF2 (blue squares) and on CaF2 (red squares). Blue solid and red dashed lines represent the dispersion of the mode for the infinite Au waveguide (with the cross-section of the antenna) on h-BN/CaF2 and on CaF2, respectively. The dashed parts of the blue curve (where as proper simulation of the dispersion was cumbersome) are a guide to the eye. Green dashed lines represent the asymptotes of the dispersion of the waveguiding mode. b–e Schematics of the infinite waveguides and the fields of the modes: wide Au stripe supporting edge SPP modes in b, h-BN slab below Au film supporting HPhP M1 mode (c), narrow Au rod supporting hybridized edge SPP-like mode and HPhP M1-like mode in d, e, respectively. The modes in d, e originate from the modes in b, c, respectively. f–i Simulated spatial field distributions of the modes of the narrow Au rod waveguide at the frequencies corresponding to the points p1 (f, h) and p2 (g, i) on the blue dispersion curve in a. The field distributions in f, h and g, i correspond to the schematics (d, e), respectively. Scale bar, 100 nm

