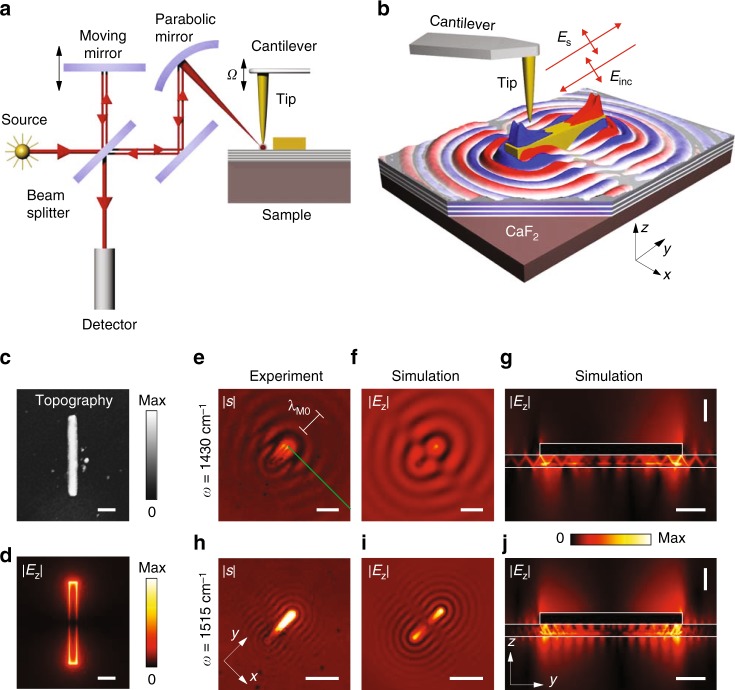
Fig. 4.
Near-field imaging of the HPhPs launched by the gold antenna. a Schematics of the s-SNOM setup. b Illustration of antenna launching of HPhPs. The spatial distribution of the near-field (shown by the red and blue colors) is adapted from the simulation of Re(Ez). c Topography of the antenna. d Simulated near-field distribution, |E(x, y)|, created by the rod antenna on CaF2 (the field is taken at the top surface of the antenna). Scale bars in c, d are 0.5 μm. e, h Experimental near-field images. f, i Simulated near-field distribution |Ez(x, y)| (taken 150 nm away from the h-BN slab). g, j Simulated near-field distribution |Ez(z, y)| taken in the cross-section plane along the center of the rod antenna. In e–g ω = 1430 cm−1, while in h–j ω = 1515 cm−1. The scale bars in e–i are 2 μm and in g, j are 0.1 μm (vertical) and 0.5 μm (horizontal). The length of the antenna in all panels is L = 2.29 μm

