Fig. 5.
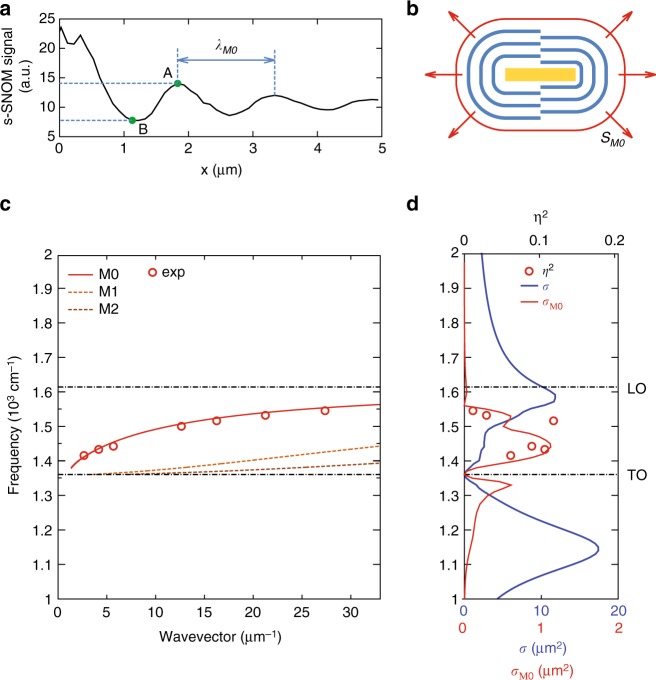
Launching efficiency of HPhPs by gold antennas. a Line scan along the green line in the near-field image of Fig. 4e. b Schematics of the launched HPhPs wavefronts (blue lines) and the Poynting vector integration contour (red line). c The dispersion of the first three HPhPs modes in the h-BN slab on top of CaF2. The red dots represent the measured dispersion (extracted 2π/λM0) from the line scans similar to a, taken at different frequencies. d The simulated launching cross-section for the resonant Au antenna, σM0 (red solid curve), and its extinction cross section, σ (blue solid curve). The red dots render the launching efficiency for the resonant antenna extracted from the line scans similar to the one shown in a

