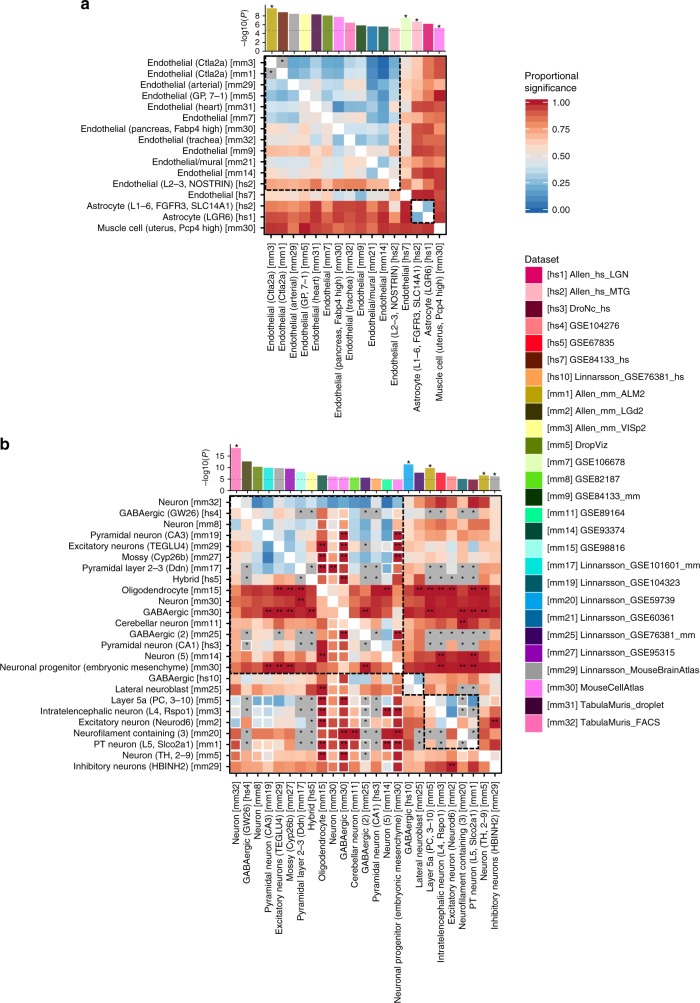
Fig. 5.
Pair-wise cross-datasets conditional analysis for coronary artery disease (a) and schizophrenia (b). Heatmap of pair-wise cross-datasets conditional analyses (step 3) for cell types retained from the step 2. Cell types are labeled using their common name with additional information in parentheses (which is needed when referring back to the label from the original study). The index of the dataset is in square brackets. The heatmap is asymmetric; a cell on row i and column j is cross-datasets (CD) proportional significance (PS) of cell type j conditioning on cell type i. The CD PS is computed as −log10(CD conditional P-value)/−log10(CD marginal P-value). The size of the square is smaller (80%) when 50% of the marginal association of a cell type in column j is explained by adding the average expression of the dataset in row i (before conditioning on the expression of cell type i). Stars on the heatmap represent pair of cell types that are colinear. Double starts on the heatmap represent CD PS > 1. The bar plot at the top illustrates marginal P-value of the cell types on x-axis and stars represent independently associated cell types. Cell types are clustered by their independence, and within each cluster cell types are ordered by their marginal P-value. For example, there are four independent associations in (a) and cell types without a star are not independent from the association of the first independent cell type (with star) on its left. The complete results are available in Supplementary Data 5. The heatmap for other traits are available in Supplementary Fig. 12

