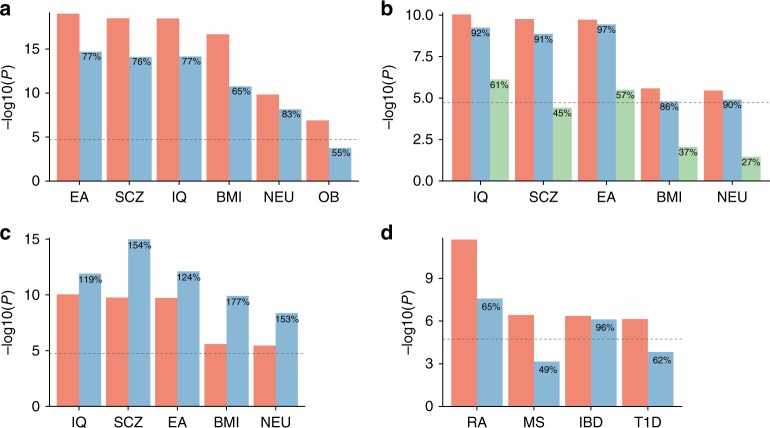
Fig. 6.
Effects of the general expression conditioned in the regression model. a Association of P-values of neuron from Tabula Muris FACS conditioning on average expression across all available cell types from multiple tissues (pink) or only brain cell types (blue). b Association of P-values of TEGLU4 (excitatory neuron from cortex) from Mouse Brain Atlas conditioning on average expression across all available cell types (pink), only neuronal cell types (blue), or only excitatory neurons (green). c Association of P-values of TEGLU4 (subtype of excitatory neurons from cortex) from Mouse Brain Atlas conditioning on average expression across all available cell types (pink) or randomly selected 35 cell types (including TEGLU4) with uniform distribution across seven cell type classes (blue). d Association of P-values of Marrow B-cell from Tabula Muris FACS conditioning on average expression across all available cell types (pink) or only immune cell types in Marrow samples (blue). The percentages displayed on the blue and green bars represent the proportional significance (in −log10 scale) compared to the pink bars. EA educational attainment, SCZ schizophrenia, IQ intelligence, BMI body mass index, NEU neuroticism, OB obesity, ISM insomnia, RA rheumatoid arthritis, MS multiple sclerosis, T1D type 1 diabetes, IBD inflammatory bowel disease

