Fig. 1.
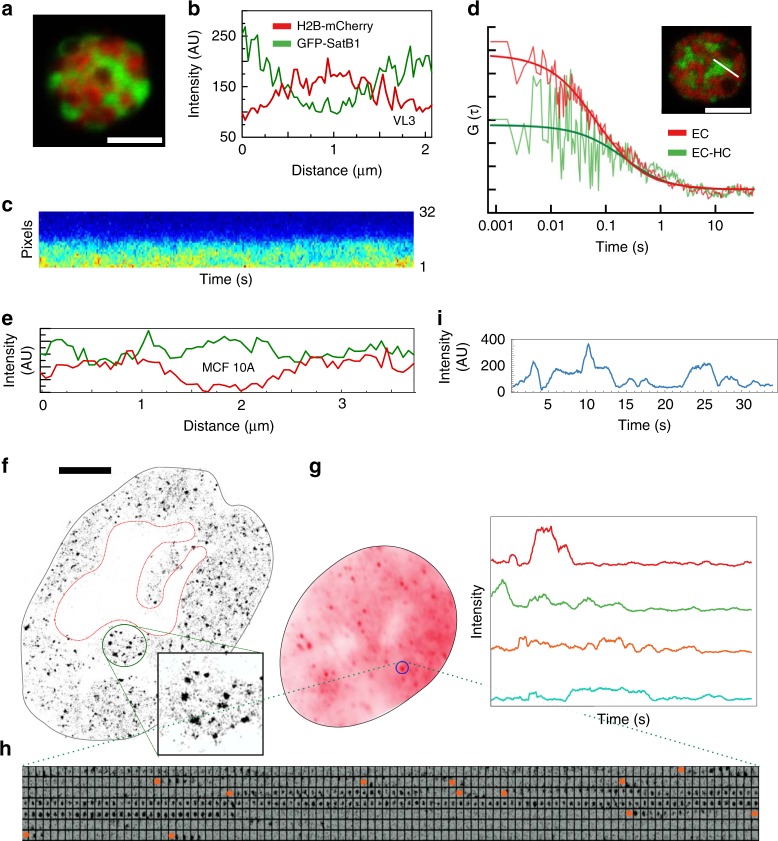
High resolution spatiotemporal analysis of SatB1 binding. a A VL3 3M2 thymocyte Satb1-eGFP knockin cell line co-expressing core histone H2B-mCherry shows the classic cage pattern. b Satb1-eGFP and H2B-mCherry profile along a line bisecting the thymocyte nucleus. c, d A 3.2 µm-line bisecting a Satb1 cage and an adjacent heterochromatin is scanned repeatedly with a pixel dwell time of 6.3 µs (32 pixels) and a line time of 0.47 ms. c A fluorescence intensity carpet generated by repeated scanning over time where the pixels are along y axis and time is along x axis. d The autocorrelation function is calculated pixel-by-pixel along the scanned line. The two autocorrelation functions shown are for one-pixel columns that reside either in the cage or at the cage-heterochromatin boundary. e Exogenous Satb1 distribution in MCF-10A cells does not show any stark difference between euchromatic and heterochromatic compartments. f Super-resolution image of Satb1 in the MCF-10A nucleus reconstructed from all localizations obtained over ~1000 frames. g Properties of the Satb1 interaction hotspots. The summed intensity of 700 frames (spanning 35 s) for a cell expressing eGFP fusion of native Satb1. Note discrete spot like structures scattered throughout the nucleus. h A 7 × 100 matrix of one region of interest (marked by circle in f) showing intensity changes over time. i. Intensity traces over time of a few chromatin interaction hot spots. Scale bar is 5 µm. SMT analysis including raw tracks are included in the Source Data file

