Fig. 6.
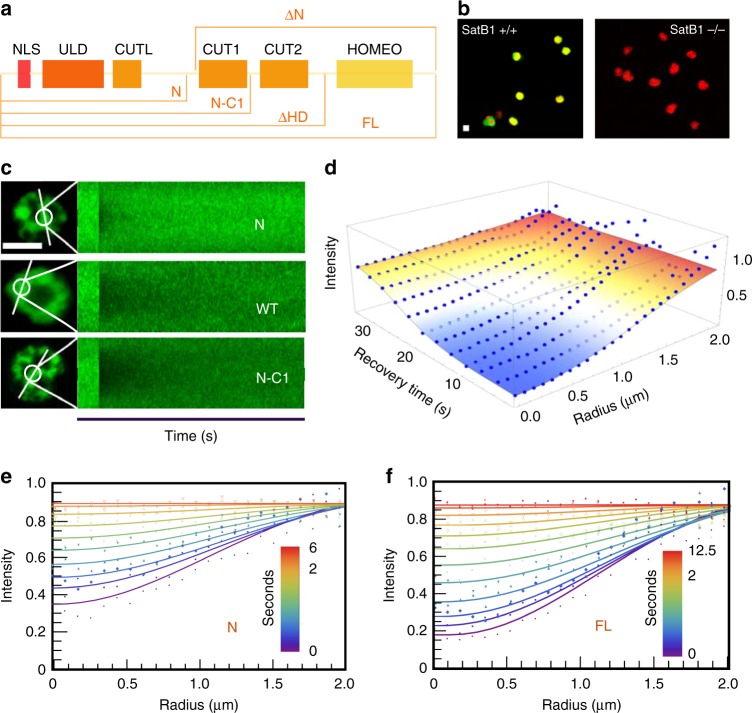
Spatiotemporal FRAP analysis of Satb1 dynamics in the nucleus. a A schematic representation of the domain organization of Satb1 and the various domain constructs which were generated to study Satb1 dynamics. b Satb1 knockout lines were generated by CRISPR/Cas9 strategy. Immunofluorescence image of WT Vl3 3M2 cells and Vl3 3M2 cells where the native Satb1 has been knocked out (Satb1 green and DNA in red) c Examples of time versus fluorescence intensity carpets of high resolution spatiotemporal maps of fluorescence bleaching and recovery along scan lines bisecting a bleach spot in Satb1−/− cells expressing exogenous eGFP fusions of FL Satb1 and different domain constructs. d The best-fit surface to a FL Satb1 spatiotemporal FRAP data. e, f The best fits of representative recovery profiles for N (e) and FL (f) are displayed at select times, with the color bar representing time in seconds. For estimates of spatiotemporal FRAP fit parameters, as well as total number of cells analyzed per condition, see tables 1 and 2. Scale bar is 5 µm. See source data for analysis and Supplementary Code 1 for custom analysis codes

