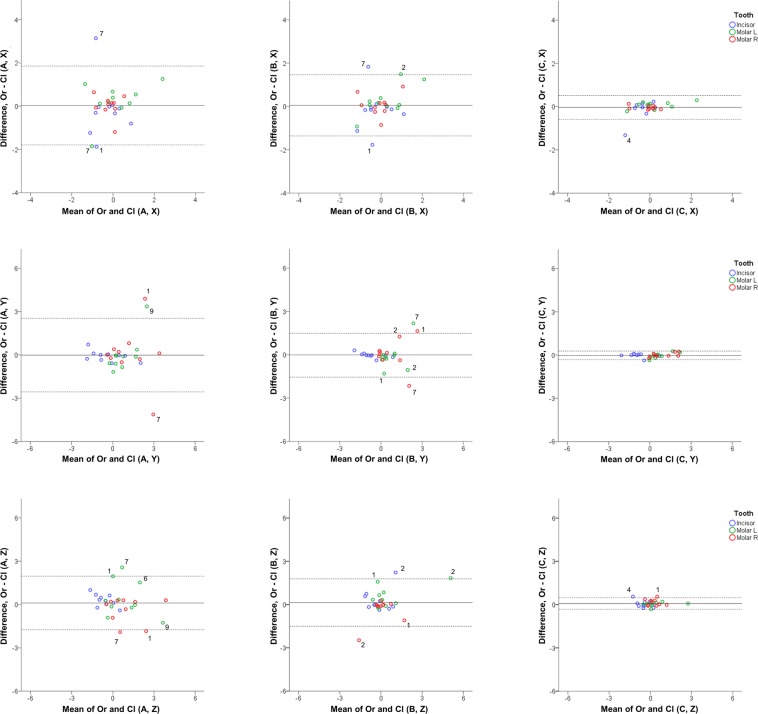
Figure 2.
Differences between original and cleaned dental model superimposition results with techniques A, B, and C. Bland Altman plots of differences of A, B, and C superimposition techniques in original and cleaned models superimposed with setting 1, at Μ1 (measurement time point 1). These refer to the measured tooth movements of the three teeth of interest in the three planes of space (mm). The axes length represents the true range of observed values of structural changes. The continuous horizontal line shows the mean and the dashed lines the 95% confidence intervals. Point labels represent patients with values located outside the 95% confidence intervals of each set of measurements.

