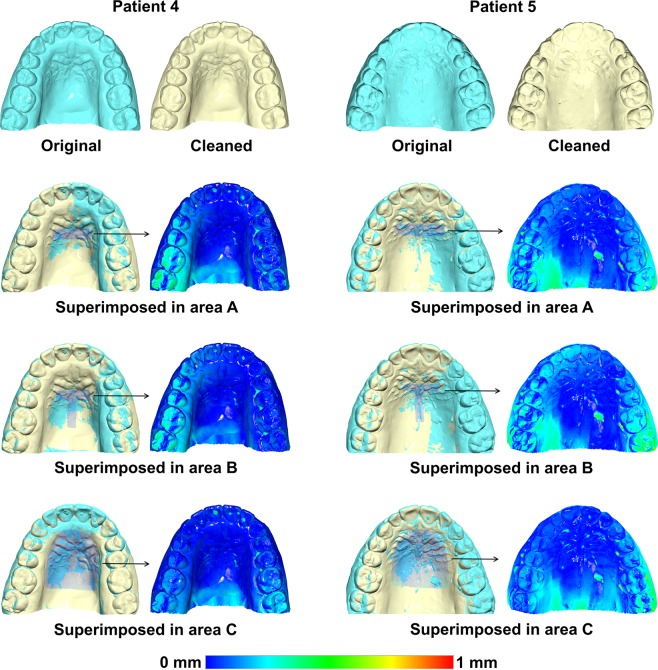
Figure 4.
Examples of original and cleaned post-treatment (T1) models superimposed on the three reference areas used in the study. As shown in the respective colour maps, Patient 4 represents a case with few artifacts in the superimposition reference areas, where the artifact removal already exerted an effect on the superimposition of the original with the subsequent cleaned model. Patient 5 represents a case with more artifacts, and these exerted a greater effect on the superimposition. This differential effect, depending on the amount of artifacts, primarily existed for areas A and B, but not for C, which was the largest one. Superimpositions were performed with setting 1, at M1 (measurement time point 1).

