Fig. 4.
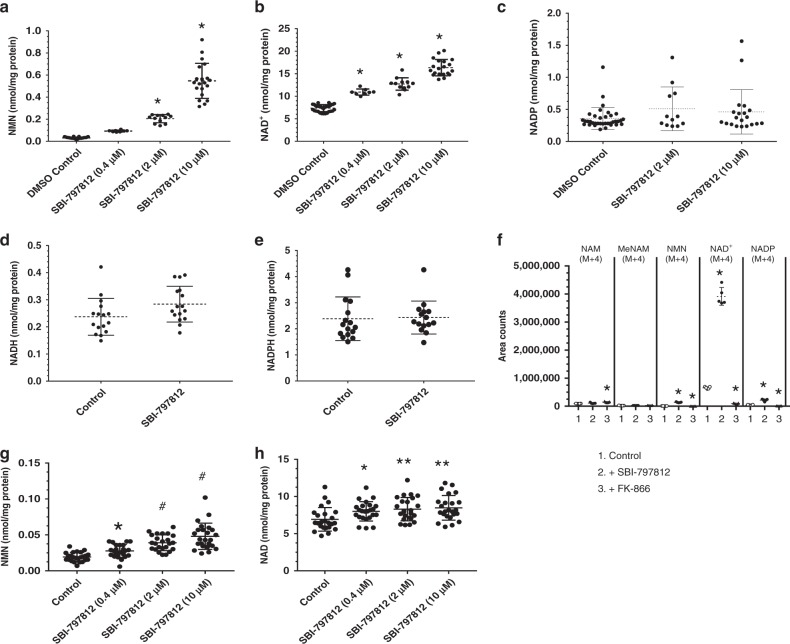
Effects of SBI-797812 on NAMPT activity in cultured cells. A549 cells treated with SBI-797812 for 4 h. NMN (a), NAD+ (b), and NADP (c) were measured by LC-MS/MS. Data shows means ± s.d.; *p < 0.0001 vs. DMSO. NMN: n = 35, 8, 12, 20 for vehicle, 0.4, 2, 10 μM SBI-797812, respectively; NAD+: n = 32, 8, 12, 20 for vehicle, 0.4, 2, 10 μM SBI-797812; NADP: n = 36, 12, 20 for vehicle, 2, 10 μM SBI-797812. One-way ANOVA with Tukey’s multiple comparisons test. NADH (d) or NADPH (e) were not increased in A549 cells treated with SBI-797812 (10 μM) for 4 h. NADH and NADPH were assayed by LC-MS/MS. Data shows means ± s.d. n = 16 except for NADPH (SBI-797812), n = 15. f NAD+ biosynthesis in A549 cells treated for 4 h with vehicle, SBI-797812 (10 μM) or FK-866 (1 μM), and 13C/15N-NAM (20 μM). NAM(M + 4), MeNAM(M + 4), NMN(M + 4), NAD+(M + 4), and NADP(M + 4) were assayed by LC-MS/MS. Data shows means ± s.d.; n = 5. *p < 0.001 vs. Control. One-way ANOVA with Dunnett’s multiple comparisons test. g, h SBI-797812 increased NMN and NAD+ in human primary myotubes. Cells treated with SBI-797812 (0.4, 2, 10 μM) for 4 h. NMN and NAD+ quantified by LC-MS/MS and normalized to cell protein. Data shows means ± s.d.; n = 24. *p < 0.05, **p < 0.01, #p = 0.0001 vs. Control. One-way ANOVA with Dunnett’s multiple comparisons test. e. f For Fig. 4a–h, source data are provided as a Source Data file

