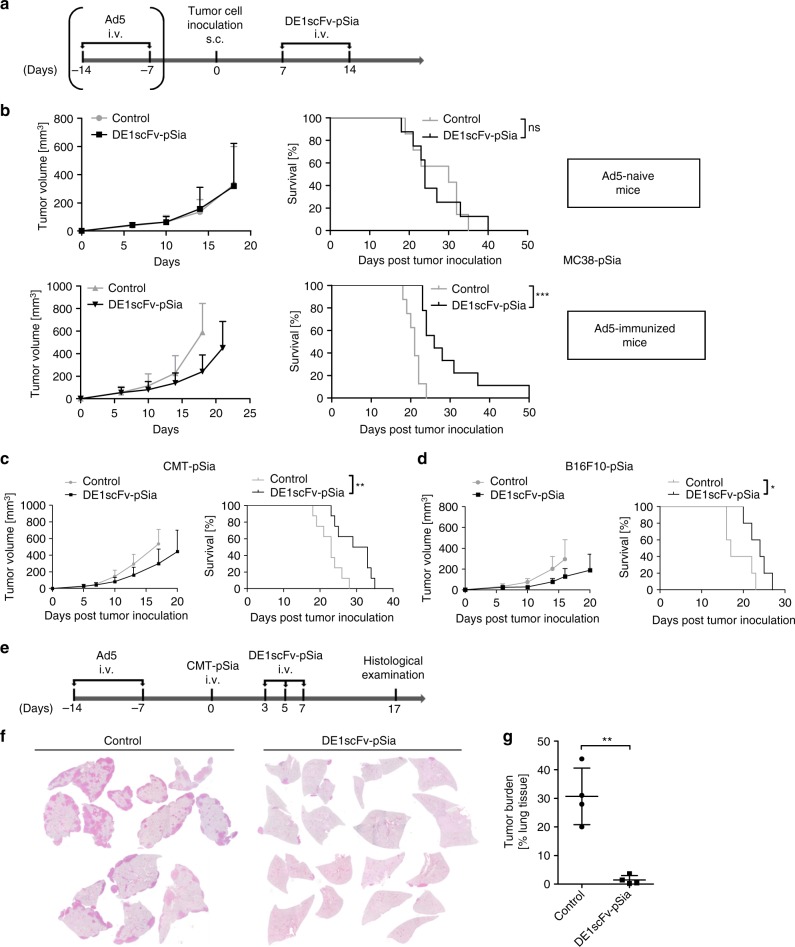
Fig. 2.
Ab-retargeting inhibits the growth of subcutaneous and disseminated tumors in Ad5-vaccinated mice. a Illustration showing the experimental time course of tumor establishement in Ad5-immunized or Ad5-naive mice by s.c. injection of PolySia-expressing tumor cells (MC38-pSia, ‚CMT-pSia, or B16F10-pSia as indicated in the Fig. 2b–d) and subsequent treatments with purified DE1scFv-pSia, or saline, respectively. b MC38-pSia tumors were established in Ad5-naive mice (upper panel) or Ad5-immunized mice (lower panel), and treated with DE1scFv-pSia or saline (control). Tumor development (left panel) and survival (right panel) were monitored. Group size: Ad5-naive control, n = 7; Ad5-naive DE1scFv-pSia treated, n = 8; Ad5-immunized control, n = 8; Ad5-immunized DE1scFv-pSia treated, n = 9. Median survival (ms) in days for Ad5-naive control: 30; Ad5-naive DE1scFv-pSia treated: 24; Ad5-immunized control: 21; Ad5-immunized DE1scFv-pSia treated: 26. c Tumor development (left panel) and survival (right panel) were monitored in Ad5-immunized mice bearing CMT-pSia tumors. Group size: n = 8; ms control: 23; ms DE1scFv-pSia: 31. d Tumor development (left panel) and survival (right panel) were monitored in Ad5-immunized mice B16F10-pSia tumor-bearing mice. Group size: n = 5; ms control: 17; ms DE1scFv-pSia: 24. e According to the shown treatment scheme, Ad5-immunized mice were injected i.v. with the lung adenocarcinoma cell line CMT-pSia to establish lung colonies. Mice were then treated i.v. with purified DE1scFv-pSia at the indicated time points or received saline as control. f Representative H/E-stained lung sections of control and DE1scFv-pSia treated individuals at endpoint examination (day 17). g Tumor burden in the lung was calculated based on microscopic investigations of H/E-stained lung sections (n = 4). Log-rank (Mantel–Cox) test was used to calculate survival in b, c, and d and two-tailed unpaired t test was used to calculate statistics in g: *p ≤ 0.05; **p ≤ 0.01, ***p ≤ 0.001. Error bars refer to standard deviation (SD). Source data are provided as a source data file

