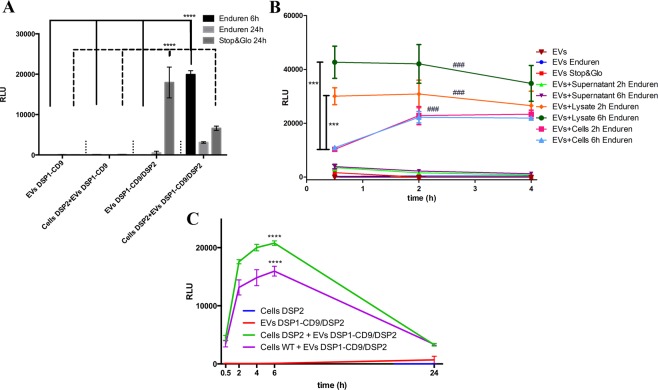
Figure 3.
EVs uptake assay. (A) DSP2-expressing target cells were preloaded with Enduren and incubated with DSP1-CD9 or DSP1-CD9/DSP2 EVs to be measured either at 6 or 24 h. Alternatively, DSP2-expressing target cells were incubated with EVs for 24 h, lysed and measured after Stop&Glo Renilla luciferase substrate addition. Signal of isolated DSP1-CD9 or DSP1-CD9/DSP2 EVs is also shown. Statistics: Statistics: ****. Two way Anova, Tukey’s multiple comparison test. n = 4. (B) DSP1-CD9/DSP2 EVs were incubated with supernatants or with mechanical obtained lysates from SUM159 WT cells preloaded with Enduren during 2 or 6 hours. EVs also were added to alive cells preloaded with Enduren at 2 or 6 hours. Controls of EVs incubated with Enduren or Stop&Glo reagent without EVs lysis are also shown. Luminescence signal from EVs with the different reagents and conditions at shown time points of incubation are depicted. Statistics: *** comparisons between EVs in the presence of cell lysates or alive cells at 0.5 hours; ### compared to EVs in the presence of cell supernatants and controls. Two way Anova, Tukey’s multiple comparison test. n = 3 (C) EV uptake kinetics using DSP2 or untransduced (WT) as target cells, pre-loaded with Enduren and incubated with DSP1-CD9/DSP2 EVs. Signal of either cells or EVs alone are also depicted. Statistics: **** compared to negative controls. Two way Anova, Tukey’s multiple comparison test. n = 4.

