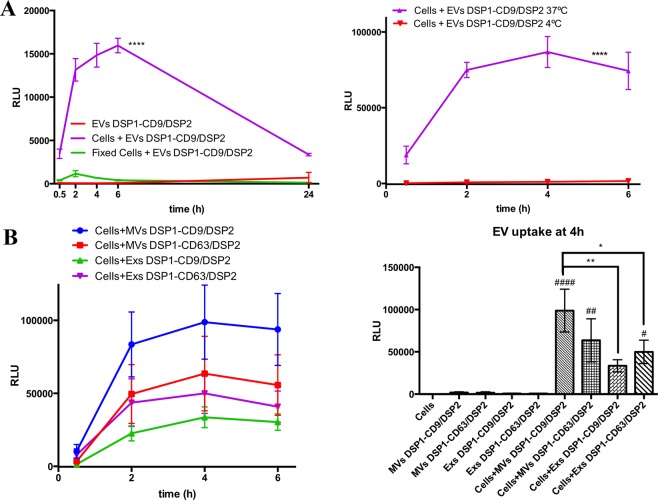
Figure 4.
EV uptake assay characterization. (A) EV uptake assays performed with receptor cells preloaded with Enduren and either fixed with 4% PFA (left plot) or performed at 4 °C (right plot). Statistics: **** comparison between non-fixed (purple) and fixed cells (green). Two way Anova, Tukey’s multiple comparison test. n = 4. EV uptake assay performed at 37 °C or at 4 °C (right plot). Statistics: **** compared to positive control at 37 °C (purple). Two way Anova, Dunnett’s multiple comparison test, n = 3. (B) EV uptake assay with EVs obtained by differential ultracentrifugation. Microvesicles (MVs) or Exosomes (Exs) from DSP1-CD9/DSP2 or DSP1-CD63/DSP2 cells were used. EV uptake kinetics are represented in the left plot. Bar plot of EV uptake signal at 4 h including all negative controls is shown in the right plot. 5.58 × 10⁹ EVs of each type were used per well. Statistics: **,* comparison between EV types; ####,##,# comparison with all the controls; p values = 0.0034**, 0.0395*, < 0.0001####, 0.0019##, 0.0311#. Two way Anova, Tukey’s multiple comparison test. n = 4.

