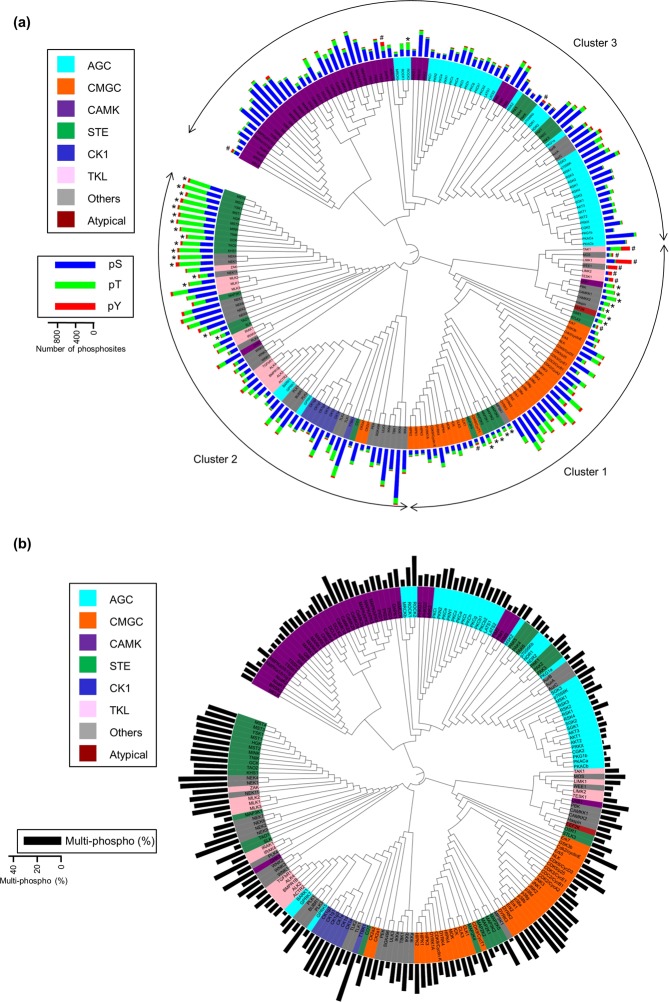
Figure 4.
Classification of serine/threonine kinases based on in vitro substrates. A phylogenic kinome tree based on the cluster analysis. The background color of the kinase name indicates the reported kinase group2 (see Supplementary Fig. S4 for TKs data). The threonine-specific kinases, i.e., those for which more than 50% of the substrate sites contain threonine, are indicated by asterisks (*). The kinases indicated by sharps (#) also phosphorylated tyrosine residues at a rate of more than 20% of their total substrates. The bars indicate (a) the number of serines/threonines/tyrosines or (b) the ratio of multiply phosphorylated peptides identified in each in vitro kinase profiling. The maximum ratio of multiply phosphorylated peptides (observed in TTBK1) is 0.39.

