Fig. 2.
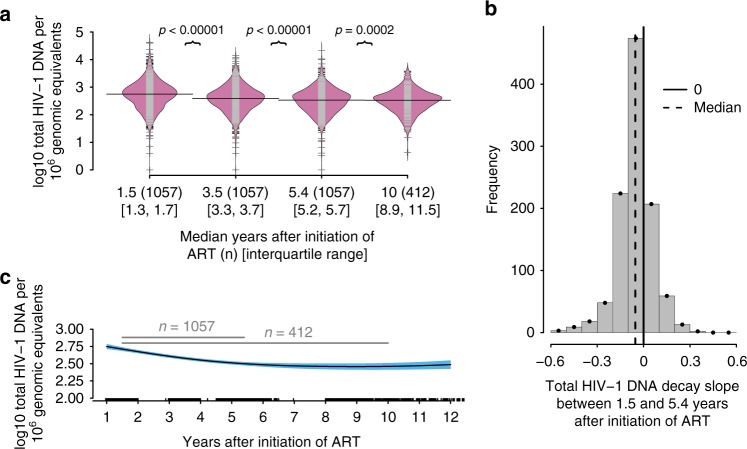
The HIV-1 reservoir size and long-term dynamics in 1057 individuals on suppressive ART for on median 5.4 years. a Beanplot of total HIV-1 DNA levels in 1057 individuals on long-term suppressive ART at 3–4 different time points (with median 1.5, 3.5, 5.4, and 10.0 years (n = 412) after initiation of ART) and the respective sample size. The p values were calculated using paired Wilcoxon tests. The individual observations are shown as small lines (gray or black) in a one-dimensional scatter plot. Overlaid is the estimated density of the distributions (filled in pink) and the median is depicted by a black line. b Histogram of linear regression slope over the first three measurements of total HIV-1 DNA levels with median 1.5–5.4 years after initiation of ART. c Spline fitted to all log10 total HIV-1 DNA/1 million genomic equivalents showing the 95% confidence intervals in blue and sampling times after initiation of ART in years on the x-axis. Gray lines indicate median observation times for respective number of individuals; ART antiretroviral therapy

